Global leaders continue to take action to secure technologies critical to national interests — such as the United States banning high-end chip technology and fabrication exports to China, and working with allies to implement export controls. Governments and individuals face mounting national security concerns over Chinese-made technology, from TikTok user data being accessible in China to Huawei bans. More than 900 Chinese-made security cameras were found in Australian government buildings, while the United States government shot down a Chinese ‘spy’ balloon.
However, until now, we have had little idea what Australians, Americans and Japanese really think about trust and distrust in technology, how that affects their choices as consumers, and associated ‘decoupling’ — the separation or disentangling of the intricate global supply chains, investments and interdependencies that produce complex technological goods.
The United States Studies Centre (USSC) conducted a public opinion survey in late 2022 across the United States, Australia and Japan, to understand public sentiment in each nation on a variety of issues — including several technology-related questions. The most notable theme in the data from these questions, released here for the first time, is that of allied collaboration and consensus between Australians, Americans and Japanese, including when it comes to trilateral collaboration on technological development. This data also highlights the level of concern individual users possess, with a shared willingness to pay more for smartphone technology not made in China, and lower levels of trust in Chinese technology and applications than in their American equivalents.
Continued support for restrictions on Chinese firms
Distrust in Chinese technology stemmed from national security concerns, with support for restrictions on Chinese firms supplying telecommunications products and developing future technology, such as quantum and artificial intelligence. The majority across all three countries agreed that restrictions on Chinese firms should either continue or increase (see Figure 1 below).
Figure 1. What should your country do about restrictions on Chinese telecommunications firms?
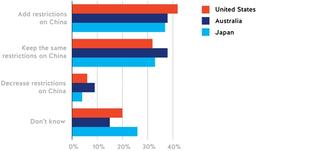
There is strong support for either maintaining (32–38 per cent) or adding to (37–42 per cent) existing restrictions in place on China across the three publics. Americans (42 per cent) are the most inclined towards adding further restrictions, while Australians (38 per cent) have the strongest preference for keeping restrictions as they are. Japanese respondents were the most unsure (26 per cent) of their position on restrictions.
Trust and distrust in Chinese and US technology
There was a similar consensus when it came to trusting technology and its origin or lineage. All three countries largely distrusted Chinese-owned technology (Figure 2a), while placing greater trust in American firms and US technology (Figure 2b).
Figure 2a: How much do you trust technology from China?
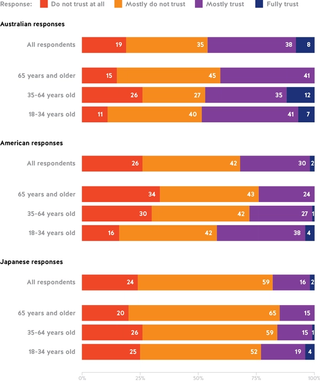
Figure 2b: How much do you trust technology from the United States?
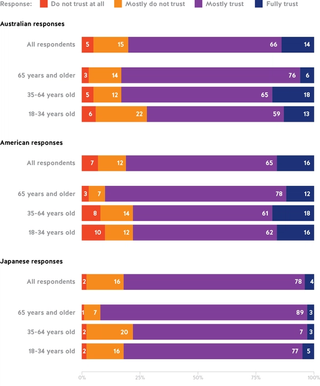
While the majority harboured distrust towards Chinese technology in all countries, a range of 29 per cent between publics suggests differing degrees of concern. Japanese respondents had the greatest distrust in Chinese technology (83 per cent), followed by the United States (68 per cent) and Australia (54 per cent). By contrast, when it came to US technology, all three countries were more trusting, and to almost the exact same degree — between 80 and 82 per cent of all three publics either fully or mostly trusted technology from the United States.
Across all three countries, there was a correlation between age and trust, with older citizens (65 and older) placing less trust in Chinese technology. For American and Japanese respondents, in particular, older generations were also more trusting of US-owned technology compared with other demographics. In Australia, it was the younger Australians (aged 18 to 34) that stood out, where 28 per cent reported a lack of trust in technologies from the United States.
When it came to apps, or mobile applications, all three publics were far more trusting of American-owned applications (Figure 3b) than those under Chinese ownership (Figure 3a). This shows the level of individual concern about mobile applications and the origin from which they were developed and run.
Figure 3a: How willing are you to download an app that is owned by a Chinese company?
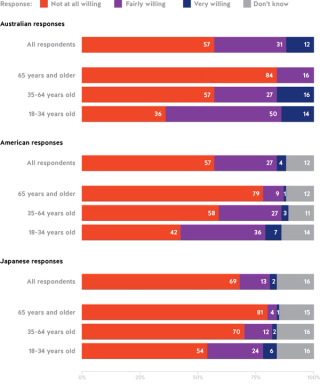
Figure 3b: How willing are you to download an app that is owned by an American company?
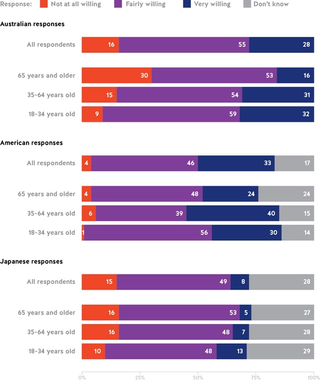
More Japanese would be “not at all willing” to download a Chinese-owned app, at 69 per cent of respondents, compared with 57 per cent of American respondents. Unfortunately, due to a data error, the Australian responses cannot be compared to Japanese or American responses, but 57 per cent were “not at all willing” to download a Chinese app. Across all three publics, older generations were again the most sceptical of Chinese-owned applications — 79 per cent of Americans and 81 per cent of Japanese respondents over 65 years were unwilling to download such an app.
All three nations had far greater trust in American-owned applications. In the United States, there was far more trust in domestically owned applications, with more than three-quarters of American voters “very willing” or “fairly willing” to download an app developed at home. Japanese voters, while far more trusting, are notably undecided — 28 per cent were unsure of their position — compared to their American counterparts when it comes to trusting American-owned applications.
Taking matters into your own hand(set) — Consumer preference against Chinese technology
Individuals were also willing to incur a personal financial cost to be less reliant on Chinese technology (see Figure 4). Almost three-quarters of Australian and American respondents would pay a $500 premium for a mobile phone that was not produced in China — a number which jumps a further 10 per cent if the cost was closer to $100. It shows a clear consumer preference for technology with a trusted lineage, and with many willing to fork out a significant sum to do so.
Figure 4. How much extra would you pay for a handset not made in China?
American and Australian consumers are willing to pay costs of decoupling from China
Some people say your country is too reliant on products made in China. If it cost more than a smartphone made in China, would you favour buying a smartphone made in a country other than China to reduce the country’s reliance on Chinese-made products?
Per cent responding with “would favour phone made in another country” rather than “would favour phone made in China.”
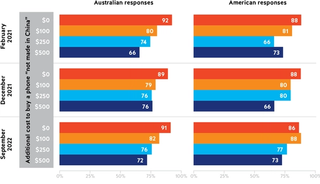
Interestingly, these numbers in Figure 4 have remained similar (within 10 per cent) across the 18 months these surveys cover (February 2021 and September 2022), showing public sentiment has not shifted significantly.
Decoupling technologies seen to be critical to national security is one thing, but individual users demonstrating such concern and distrust in Chinese technology adds a different dimension to the conversation. Whilst it is hard to know how many of these stated intentions will translate to action, it nevertheless shows a clear individual preference for technology with a trusted lineage.
Across multiple data points, this polling indicates that the US, Australian and Japanese publics are largely distrustful of technology coming from China and have greater confidence in trusting US technology.
Enthusiasm for trilateral collaboration
A similar consensus is echoed when it comes to cross-country collaboration on the development of emerging technologies like artificial intelligence, quantum computers, and semiconductor manufacturing (see Figure 5). These emerging technologies will be the foundation of technological innovation into the future, and all three publics show enthusiasm for embracing these while strengthening the ties between their nations. Australian, Japanese and American respondents were overwhelmingly in favour of broadening the alliance agenda through trilateral technology collaboration — across all three nations, less than five per cent on average expressed any reservations about collaboration.
Figure 5. Should your country collaborate with the other two countries on the development of technologies like artificial intelligence, quantum computing and semiconductor manufacturing?
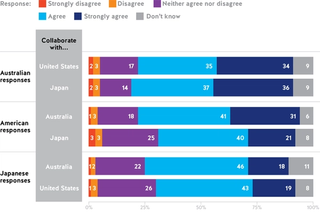
Australia had the largest cohort who “strongly agree” to collaborating with their two allies (an average of 35 per cent), followed by Americans (26 per cent) and then the Japanese (18.5 per cent). When combined with a shared distrust in Chinese-made technology and apps, and support for restrictions on Chinese firms, enthusiasm for trilateral technology collaboration — averaging between 61 and 73 per cent across all three countries for those that “agree” or “strongly agree” — signals an impressively homogenous set of opinions between allies in the current geopolitical environment.
Many of the themes and topics covered by this data are central to our upcoming work in the Emerging Technology program here at the USSC. You can subscribe to our ‘Emerging Technology’ mailing list to keep up to date.
This polling was conducted by YouGov. The methodology for this polling can be found in our broader report for the midterm elections.


