Preface
Educating Australians about the United States is the core mission of the United States Studies Centre. This is encapsulated in the Centre’s motto, Analysis of America, Insight for Australia.
Seldom has this task been as challenging; never has it been as important.
The challenge of our mission is evidenced by the number and magnitude of the surprises that the United States has provided in recent years. Beyond the 2016 election results, few predicted that support for a more confrontational US approach to China would remain deeply bipartisan, that President Trump would impose such broad tariffs on allies, or that the economic consequences of tariffs and a trade war with China would be as mild as they seem to be at this time.
Attention is now increasingly turning to what comes next and the implications for Australia. A common thread running through so many questions about the United States turn on the permanence or transience of the politics and policies of Trump era. Is this temporary or the new normal?
A common thread running through so many questions about the United States turn on the permanence or transience of the politics and policies of Trump era. Is this temporary or the new normal?
For instance, what elements of the “America First” foreign policy will survive should Trump not be re-elected, or be accelerated should Trump win a second term? Is protectionism and the turn away from multilateralism specific to the Trump administration or indicative of a deeper shift in American public opinion? Are the American people as sceptical about allies as the president appears to be? What is America’s appetite for a Cold War-like contest with China?
Then there’s US domestic affairs and politics. Will the partisan division and acrimony we see in American politics ever recede? Can the United States reconcile its constitutional and cultural commitments to personal liberty with ever-growing economic inequality? Are the foundations of American political economy — the links between partisanship, race, wealth and geography — being remade or reinforced by President Trump?
These questions motivated our multi-faceted comparison of public opinion of both the United States and Australia; a rigorous examination of where the United States and Australia are some three years into the Trump presidency.
We asked Americans and Australians for their views on a wide array of political and social issues, spanning perennials such as state power, inequality and personal freedoms, to gun control, climate change and racial prejudice, to assessments about international security challenges — including foreign interference, alliances and the rise of China — and the implications of rapid technological change.
Many Australians think they know the United States. But events of recent years reveal the limits of our collective understanding. Within the 50 US states and its territories resides the world’s third-largest nation by population, the world’s largest number of immigrants, and more cultural and racial diversity than almost any other developed nation. This immense geographic and demographic diversity is simultaneously a wellspring of the United States’ resilience and a challenge for analysts and observers.
What better reference point for Australians seeking to better understand the United States than Australian public opinion on the same critical issues?
Hence our decision to also survey Australians, fielding exactly the same questions, in the same order, at the same time, using the same methodology as we deployed in the United States. Comparisons of the American and Australian responses let Australians understand points of similarity and difference with our most important ally. What better reference point for Australians seeking to better understand the United States than Australian public opinion on the same critical issues?
Australia’s relationship with the United States is entering a new chapter, set against a resurgence of great power rivalry — much of it taking place in the Indo-Pacific — and a renewed appreciation of the multiple channels through which nations compete and cooperate, through which nations build and project power. Accordingly, Australia’s strategic significance has risen rapidly in recent years; so too has the importance of the US-Australia alliance in American eyes.
The United States Studies Centre is committed to helping Australia understand how America is responding to these strategic challenges, at a time when so much seems unpredictable and unsettled in American politics and society. Much depends on understanding our most important ally at this moment of history. This survey — and our analysis in this report — is a major contribution to this nationally significant goal, at the heart of the Centre’s mission.
Simon Jackman
Chief Executive Officer and Professor of Political Science
United States Studies Centre
Executive summary
Australia has a great deal in common with the United States. Both are settler societies, originally founded as British colonies, with a similar cultural heritage, with political systems valuing personal freedoms and democratic institutions. Shared values and a similar outlook on the world support the broad and deep relationship between the United States and Australia.
These commonalities are clear to see in the results of our survey. For instance:
- Americans and Australians believe their societies are meritocracies. A total of 58 per cent of Americans and 56 per cent of Australians believe that hard work drives success, but smaller proportions are optimistic that one can rise from poverty to wealth in either country (page 9).
- Sizeable majorities in both countries support an expansive definition of the right to free speech (page 16).
- Nearly all Americans (97 per cent) identify Australia as a friend or ally of the United States. Most Australians regard the United States similarly (94 per cent), consistent with both major Australian political parties placing the US alliance at the heart of Australian defence policy and strategic thinking (pages 18-20).
- Only one in five Americans and Australians would prefer more Chinese investment in their own respective countries (page 24).
- Three-quarters of Australians and two-thirds of Americans agree climate change is occurring (pages 50-51).
- We also find that overt expressions of racial prejudice are common in both countries, and that prejudice has a strong association with partisanship in both countries (pages 56-61).
- Three-quarters of women in both countries — but only slim majorities of men — say that men getting away with sexual harassment and assault is a major problem (pages 43-45).
- Americans and Australians are wary to unsure about the consequences of artificial intelligence for work and labour markets (pages 62-67).
However, for all these similarities, there are important differences in the views of Americans and Australians. For instance:
- Australians are more supportive than Americans of the state intervening in the economy to prevent and remedy inequality on matters spanning taxes and wages to health care and higher education (pages 11-13).
- While support for Australia is a rare instance of bipartisanship in the United States, there is partisan disagreement among Australians in their overall sentiment towards the United States. Sixty-seven per cent of Coalition supporters describe the United States as an ally of Australia, but only 53 per cent of Labor supporters do the same. This 14 point difference is by far the largest partisan difference observed in assessments of Australia’s relationships with 14 countries (pages 20-21).
- Australians are more aware of and concerned by China and Beijing’s strategic aspirations (pages 22-30) than Americans. Australians are more likely to say the United States and China are in a new Cold War (39 per cent versus 28 per cent). Furthermore, 63 per cent of Australians and 51 per cent of Americans agree that their respective country is too economically dependent on China. Australians are more likely to report concern about Chinese political interference (65 versus 56 per cent).
- Deep partisan disagreement is the defining characteristic of American public opinion in the age of Trump. On issue after issue, the view of those who voted for Donald Trump in 2016 and those who voted for Hillary Clinton differ by substantially greater margins than the differences between Coalition and Labor voters in Australia. Americans’ attitudes towards Australia and China are rare exceptions to this political polarisation (pages 14-15).
- More Australians than Americans support additional restrictions on gun ownership in their country, despite the fact that it is already much more difficult to obtain a gun in Australia than the United States (pages 40-42).
- Unlike Americans, most Australians support women having access to abortion as a personal choice (58 per cent of Australians to 42 per cent of Americans; pages 46-49).
- President Trump is remarkably unpopular in Australia, with just 20 per cent of Australians saying they would prefer that Trump wins a second term (page 70). Question-wording experiments in this survey show that support for “US government” policies fall when they are described as “Trump” or “Trump administration” policies (pages 30-32).
Two broad conclusions become apparent after considering the many similarities as well as striking differences between the United States and Australia.
As much as Australians may dislike the current US president, most Australians hold positive evaluations of the United States and of Australia’s relationship with the United States.
Australians can clearly differentiate between a president and a country. As much as Australians may dislike the current US president, most Australians hold positive evaluations of the United States and of Australia’s relationship with the United States.
Second, while the United States seems so familiar to many Australians, there is clearly much about the United States that Australians don’t appreciate. In particular, conservative viewpoints in Australia generally land much closer to progressive or moderate stances than they do in the United States. In turn, on almost every issue we find greater partisan and ideological differentiation in the United States than in Australia. This needs to be remembered by Australians as we look ahead to the 2020 election, to the policy direction of the United States after the election, and to appreciate the significance of rare moments of bipartisanship in the American system, particularly in foreign policy and strategic outlook.
The data provided by this survey — and our analysis — helps Australians better understand these facets of American public opinion, politics and policy and their implications for Australia.
Freedom versus fairness: The United States and Australia compared
Liberty sits not just at the centre of the US Constitution, but also in global public opinion about American society.1 For both Americans and Australians, only American technological prowess and cultural predominance rival liberty as favourable aspects of the United States.
Respondents to our surveys in both countries were presented with six aspects of American society, randomly selected from a list of 13. They were asked whether they had a favourable or unfavourable impression of each aspect they were presented.
Americans were generally — and understandably — more positive about their country than Australians: in every case Americans reported higher favourability ratings of the United States than Australians, typically by about 20 percentage points. Yet as much as Americans viewed their country more favourably than Australians, both Americans and Australians had a remarkably similar rank ordering of aspects of American society that they liked and disliked. Figure 1 shows the percentages of respondents in either country that gave either a very or somewhat favourable assessment of each of 13 aspects of American society. In 11 of 13 cases, more than 50 per cent of Americans reported a favourable view of the particular aspect of American society; only in six of 13 cases did a majority of Australians report a favourable assessment.
Figure 1. Australians see the United States less favourably than Americans
Question: Do you have a favourable or unfavourable opinion of the following aspects of American society?
% of Australian and American respondents reporting favourable evaluations of thirteen aspects of American society, ranked by combined average of favourability. Numbers in the column on the right of the graph indicate differences in US and Australian favourability ratings.
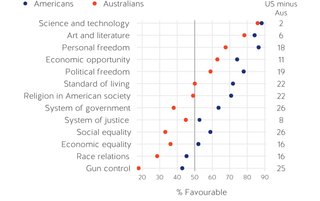
In both countries, American science and technology, as well as art and literature, received the highest favourability ratings — in excess of 87 per cent in the United States and 79 per cent in Australia. Various freedoms were highly valued by American survey respondents, who gave “personal freedom” the second-highest favourability score (87 per cent) and “political freedom” fourth-highest (78 per cent favourability), ahead of “economic opportunity” (74 per cent). Australians held generally favourable views of these aspects of American society, albeit with slightly less enthusiasm than Americans. Personal freedom in the United States was viewed favourably by two-thirds of Australians, ranking third of the 13 aspects of American society, with economic opportunity in fourth place (63 per cent) and political freedom fifth (59 per cent). Consistent with the historical, legal and cultural traditions of the United States, various forms of “freedom” in the United States were assessed more favourably than various forms of “equality”, a pattern which is broadly mirrored in Australian assessments of these dimensions of American society.
Larger than typical differences in favourability across the two countries were with respect to the US “standard of living” (72 per cent favourability among Americans versus 50 per cent among Australians), “religion in American society” (71 per cent versus 49 per cent), “system of government” (64 per cent versus 38 per cent), “social equality” (59 per cent versus 34 per cent) and “gun control” (43 per cent versus 18 per cent). In addition to gun control, Australians have especially unfavourable assessments of race relations in the United States (29 per cent favourable), social equality (34 per cent) and economic equality (36 per cent).
Partisan differences
In both the United States and Australia, there was a near-universal pattern of partisans from the right being more approving of any given aspect of American society than partisans of the left. This pattern was especially pronounced in the United States itself.
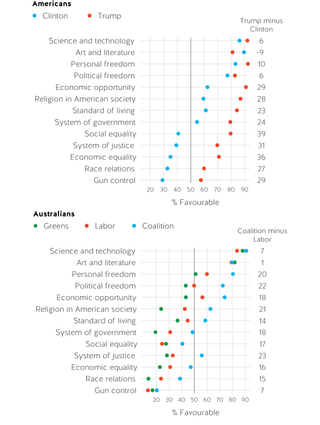
Figure 2 displays these partisan differences in each country. In 12 out of 13 aspects of American society, Trump voters gave more favourable assessments than Clinton voters, with the exception being art and literature. Across the 13 aspects, the median partisan difference in assessments was 27 percentage points. Especially large differences are apparent with respect to assessments of US social equality (Trump voters at 80 per cent versus Clinton voters at 41 per cent, a 34 point difference), economic equality (71 per cent to 35 per cent, a 36 point difference), the US justice system (70 per cent to 39 per cent, a 31 point difference), and gun control (58 per cent to 29 per cent, a 29 point difference).
Even on perceptions of the positive and negative aspects of American society, we find evidence of partisan polarisation in the United States. While a majority of Clinton voters had favourable assessments in eight instances, a majority of Trump voters had favourable assessments in all 13 aspects of American society. Trump voters provided especially favourable ratings of personal freedom (93 per cent), science and technology (92 per cent), economic opportunity in America (91 per cent) and religion in American society (87 per cent). Clinton voters were especially dour with respect to gun control in American (29 per cent favourable), race relations (33 per cent favourable) and economic equality (35 per cent).
Australian respondents were not only less favourable overall towards the United States, but exhibited much less partisan disagreement, with a median difference between Coalition and Labor voters of 17 percentage points. A majority of Coalition voters provided favourable assessments of the United States in eight out of 13 instances. For Labor voters, a majority provided favourable assessments in four out of 13 instances. For Green identifiers, favourable assessments prevailed in just three out of 13 instances (American science and technology, art and literature and personal freedom).
Figure 2. Americans more polarised than Australians about US society
Question: Do you have a favourable or unfavourable opinion of the following aspects of American society?
% of Australian and American respondents reporting favourable evaluations of 13 aspects of American society, by vote and country. Numbers in the column on the right of the graph indicate differences in favourability ratings by recent major vote.
Lands of opportunity?
To a first approximation, Americans value liberty over equality. Deeply embedded in this value system is the belief that an individual’s hard work is the key pathway to prosperity and economic mobility. As Max Weber observed over a century ago,2 the normative value of individual hard work and thrift has deep historical and cultural roots in the United States. For instance, the Puritan form of Protestantism powerfully shaped the Founders’ proscriptions about the roles of the individual and the state.3
But how prevalent are these beliefs in contemporary American society? Relative to Americans, are Australians more or less likely to accept what might be loosely called a Protestant work ethic? To assess this, respondents were asked if they agreed with two propositions: that (1) “Hard work and ability determine how well off a person becomes” and (2) “Luck is more important for financial success than hard work”.
Figure 3. Americans more polarised than Australians about determinants of success
Question: Do you agree or disagree that hard work and ability determine how well off a person becomes in your country?
% of respondents agreeing
Question: Do you agree or disagree that luck is more important for financial success than hard work?
% of respondents agreeing
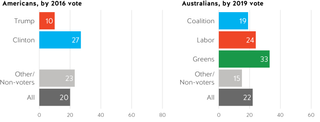
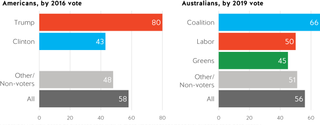
Figure 3 shows that overall levels of agreement with the two statements were strikingly similar in both countries. Slim majorities in each country agreed that hard work and ability determine financial success (58 per cent in the United States, 56 per cent in Australia). Only 20 per cent in each country agreed that financial success turns more on luck than hard work. But under the surface, there was considerable disagreement, especially in the United States.
There was a sharp partisan gradient in the rates of agreement with these propositions in the United States, much more so than in Australia. Eighty per cent of Trump voters but less than a majority of Clinton voters (43 per cent), agreed that hard work and ability determine financial success. In Australia, the difference in Coalition and Labor voters on this score was far smaller (66 per cent versus 50 per cent, with Greens voters 45 per cent). One should note that Clinton voters, with just 43 per cent in agreement, lag Labor voters in Australia (50 per cent) and match Greens voters (43 per cent).
Similarly, just ten per cent of Trump voters agreed that “luck is more important for financial success than hard work”, compared with 27 per cent of Clinton voters. In Australia, just five percentage points separated Coalition and Labor voters (19 per cent versus 24 per cent with 33 per cent of Greens voters agreeing). Coalition voters were twice as likely as Trump voters to agree that luck is more important than hard work (19 per cent versus ten per cent).
Economic mobility
Deeply ingrained in both the United States and Australia is the notion that each country is a land of opportunity, that economic mobility — moving up the income, status and class hierarchy over one’s working life — is a vital companion to the value system. This value system prizes hard work and thrift, prosperity and economic security — the reward awaiting those who live their lives accordingly to those values. But over the post-war period, economic mobility has slowed considerably in the United States, and to a lesser extent in Australia.4 Growing economic inequality — largely driven by outsized growth in the wealth and income shares of the already-rich — is likely the chief culprit, challenging the promise of economic mobility both as a matter of fact and public opinion.5
Deeply ingrained in both the United States and Australia is the notion that each country is a land of opportunity, that economic mobility — moving up the income, status and class hierarchy over one’s working life — is a vital companion to the value system.
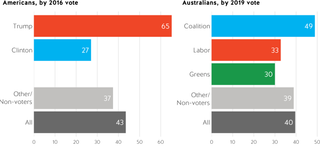
Respondents were asked “how common is it for someone to start poor, work hard and become rich?” Figure 4 shows that majorities in both the United States and Australia believed economic mobility is more uncommon than common. Less than half of both Americans and Australians said economic mobility is very or somewhat likely, with 43 per cent of Americans and 40 per cent of Australians giving the very or somewhat responses.
Again, a sharp partisan difference was clear in the United States, with almost 40 percentage points separating Trump voters (65 per cent) and Clinton voters (27 per cent). Conversely in Australia, only 16 points separated the two main political parties, with Coalition at 49 per cent to Labor’s 33 per cent. Trump voters were the only voting bloc in either country in which a majority agreed with economic mobility being more common than not.
Figure 4. US and Australian conservatives have more faith in economic mobility in their countries than progressives
Question: How common is it for someone to start poor, work hard and become rich?
% of respondents saying it is very or somewhat common for someone to “start poor, work hard and become rich”
The role of the state
Limited government — and limits on state intervention in the economy — are key elements of the American embrace of liberty. Born of revolution against the British state and its monarchy, the formal powers of the US government are sharply delimited in the US Constitution and its first ten amendments, the Bill of Rights.
The founding of the Australian state followed an altogether different path. European settlement of Australia began as a project of the British state, triggered in part by the loss of the American colonies. The Australian nation-state was created not out of revolution, but through a long yet civil campaign involving public debates, constitutional conventions and ultimately mass plebiscites. Nonetheless, the legal validity of Australia’s Federation and the Australian Constitution ultimately rests on enabling legislation passed by the “mother parliament” in Westminster.6 Among the first significant acts of the new Australian state was not enshrining limits on state power a la the US Bill of Rights, but to establish a system of courts to regulate industrial relations and to administer a system of centralised wage setting.7

Little surprise, therefore, that Americans and Australians displayed different views about state intervention aimed at redistributing wealth and income. Figure 5 summarises responses to five proposed exercises of state power, including keeping wages above the poverty line, assistance for the unemployed, free university education, reducing the cost of non-elective medical procedures and increasing taxes on the rich.
In all five instances, Australians were more likely than Americans to support the use of state power to reduce inequality. The largest difference was with respect to the proposition that “the government should provide funding for hospital visits for emergencies and operations to lower the cost for patients”. Eighty-two per cent of Australians agreed with this proposition — which is largely a settled and established matter of public policy in Australia — compared with just 52 per cent in the United States, a difference of 30 percentage points.
Just 57 per cent of Americans believed that “the minimum wage should be high enough so that no family with a full-time worker falls below the official poverty line”, compared with 84 per cent of Australians, a difference of 27 percentage points. On providing a “decent standard of living for the unemployed”, there was a 21 point difference between Americans and Australians, 40 per cent to 61 per cent. Of the five propositions, rates of agreement were most similar between the two countries with respect to “increasing taxes on the income and wealth of the rich”, with only a four-point gap (48 per cent in the United States versus 52 per cent in Australia).
Figure 5. Americans more polarised on social safety net and taxes than Australians
Question: Do you agree or disagree with the following statement?
% of respondents agreeing with propositions
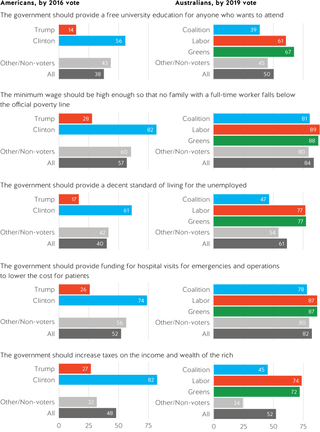
Another key distinction between the two countries was the extent of partisan polarisation on these matters in the United States relative to Australia. Trump and Clinton voters disagreed profoundly on these matters, with differences in their rates of agreement ranging from 42 percentage points (“The government should provide a free university education for anyone who wants to attend”) to 55 points (“Increasing taxes on the income and wealth of the rich”). Majorities of Clinton voters agreed with each of the five propositions; agreement levels among Trump voters never rose above 28 per cent.
In Australia, Labor and Coalition differences ranged from eight percentage points (89 per cent versus 81 per cent on keeping the minimum wage above poverty levels) to 30 percentage points (77 per cent versus 47 per cent on “the government should provide a decent standard of living for the unemployed”). Thus, not only were Australians more supportive of the state intervening to reduce inequality, there is far less partisan division on these propositions than in the United States.
Trump voters are different
Much of the difference between Australian and American preferences for redistribution can be attributed to the distinctly conservative positions of Trump voters. To examine this further, a scale was constructed to measure “left” to “right” or liberal to conservative preferences for each respondent. In this method, their responses to seven survey items — on government intervention in the economy and the value of hard work in contributing to an individual’s economic circumstances — were averaged and then mapped.8
Figure 6 summarises the distribution of ideological views in both Australia and the United States, showing the mean position of the supporters of each party (in Australia) or 2016 presidential candidate (for the United States). There is no overlap between the ideological locations of the middle 50 per cent of Trump voters and Clinton voters on this scale,9 a measure of the polarisation of the American electorate.
Not only did Australian preferences tend to be to the left of American preferences, but Figure 6 also highlights that the Australian electorate was less polarised than the American electorate. The range of median scores for Australian voting blocs — -0.1 for Coalition voters, -0.6 for Labor voters and -0.8 for Greens voters. This range of 0.7 scale units was far smaller than the 1.8 unit Trump-Clinton difference in the United States.
Figure 6. US and Australian voters on the political spectrum: Coalition voters ideologically closer to Clinton voters than Trump voters
Ideological positions of voting blocs, United States and Australia, based on factor analysis of seven items on inequality and state intervention. Points indicate medians of the resulting scale measure; thick lines indicate 25th to 75th percentiles; thin lines extend to 10th and 90th percentiles.
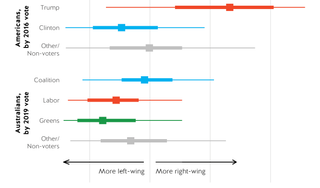
There was also much more overlap in the ideological positions of Australian voting blocs than in the United States. For instance, a quarter of Coalition voters were more left-leaning than about a half of Labor voters. Symmetrically, the most conservative quarter of Labor voters had preferences to the right of almost half of Coalition voters.
Cross-country comparisons also highlight the unusually conservative preferences of Trump voters. Clinton voters were generally to the left of Coalition voters but had an almost identical distribution of scale scores to Labor voters in Australia. That is, voters for parties of the left in Australia and the United States had similar preferences, but Trump voters were far more conservative than Coalition voters. But three-quarters of Trump voters were more conservative than the most conservative 25 per cent of Coalition voters. Indeed, Trump voters were so conservative that the vast bulk of Coalition voters have preferences closer to Clinton voters than Trump voters.
Freedom of speech
Freedom of speech enjoys an exalted place in the American political tradition, with broad prohibitions against the regulation of political expression enshrined in the First Amendment to the US Constitution. Few democracies revere free speech to this extent. Australian constitutionalism, law and courts have long recognised limits to what can be said in the public square. Australian jurisdictions are some of the most plaintiff-friendly domains in the English-speaking world for defamation actions. Bans on public demonstrations, criminalising “hate speech” and the widespread use of orders prohibiting media comment on court proceedings are just some of the ways speech is more regulated in Australia.
Differences in attitudes towards free speech rights between Australia and the United States are an important and vivid indicator of differences in the political cultures of the two countries. But so too is the conditional nature of free speech rights. Even in the United States, free speech is not a free for all. To whom or under what conditions will free speech rights be granted or assented to, and by whom? Testing this conditionality of free speech commitments helps us better understand how embedded and foundational this freedom is in the United States and Australia.
Survey respondents in both countries were asked whether they agreed or disagreed that “People should be able to make public comments” in six hypothetical situations. The six hypothetical circumstances ranged from the less controversial, “comments that are critical of government policy”, with large majorities in favour, through cases such as “comments that are offensive to religion or beliefs”, to “ethnic minorities” or “call for violent protests”.
Figure 7. Americans have more expansive view of free speech than Australians
Question: Do you agree or disagree that people should be able to make public comments that are ........?
% of respondents agreeing
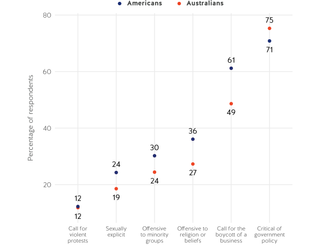
While the views of the two countries on freedom of speech issues were slightly different, the ranking of speech cases was identical. Public comments critical of government policy was supported by 75 per cent of Australians and 71 per cent of Americans. Just 12 per cent in both countries agreed that people should be able to make public comments that “call for violent protest”, with little to no partisan variation within either country.
Averaged over the six measures, Americans were generally more supportive of free speech than Australians. But Americans were more tolerant than Australians of public comments that are “sexually explicit” (24 per cent to 19 per cent), “offensive to minority groups” (30 per cent to 24 per cent) and “offensive to religion or beliefs” (36 per cent to 27 per cent).
In late 2019, senior members of the Australian government were said to be considering legislation to curtail coordinated boycotts of businesses.10 Public speech that advocates for boycotting businesses is supported by only half of Australians, with just 36 per cent of Coalition voters having agreed that speech of this sort should be permitted, compared to 55 per cent of Labor voters (Figure 8). Americans were generally much more supportive of the right to this form of public speech, with 61 per cent overall having agreed, for a 12 point difference between the two countries. Even 56 per cent of Trump voters supported this form of public speech, 20 percentage points higher than the agreement rate among Coalition voters in Australia. Seventy-one per cent of Clinton voters agreed that people should be able to call for boycotts of businesses, 16 points higher than for Labor voters and six points higher than for Greens.
Figure 8. Legality of calling for boycotts a more politically divisive topic in Australia than in the United States
Question: Do you agree or disagree that people should be able to make public comments that are ........?
% of respondents agreeing
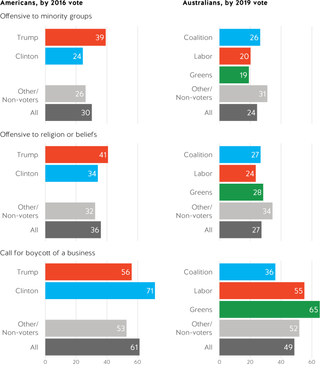
In both countries, conservatives were more supportive of free speech rights that are offensive to minorities than are progressives. In the United States, 39 per cent of Trump voters agreed that these comments should be allowed, compared with 24 per cent of Clinton voters. In Australia, 26 per cent of Coalition voters and 20 per cent of Labor voters agreed. Similarly, the right to make public comments offensive to religion or beliefs was supported by 41 per cent of Trump voters, but just 34 per cent of Clinton voters. A mere three-point difference was found between Coalition and Labor supporters on the measure (27 per cent versus 24 per cent). This preference ordering is reversed for business boycotts, with progressives more supportive — with Clinton voters 15 points more in favour than Trump voters and Labor voters 19 points more in favour versus Coalition voters.
While free speech is generally more universally supported in the United States than Australia, patterns in its conditionality — the conditions under which people will yield those rights — were broadly similar, mapping onto familiar fault lines with each country, corresponding to self-interest, ideology and prejudice.
Australia and the United States as allies
Australia is a highly regarded ally within the United States’ political and foreign policy establishment. Australia is the only country to have fought alongside the United States in every major conflict since the Second World War. The United States also runs a trade surplus with Australia, and Australia is one of the rare US allies that has lifted its defence spending to two per cent of GDP — both key metrics of being a good friend from the perspective of the Trump administration. The two countries have shared a formal security alliance since 1951 and as Australia’s pre-eminent security and investment partner, the United States is far and away Australia’s most important international partner.11
But how do ordinary Americans and Australians view the relationship between Australia and the United States?
Respondents in both countries were asked to assess 14 other countries as either (1) an “ally” of their country, as (2) “friendly” or (3) “unfriendly” towards their country, or (4) as an “enemy” of their country.12
Six in ten Americans reported that Australia is an ally of the United States, a rate exceeded only by two other countries: the United Kingdom (65 per cent) and Canada (64 per cent) (Figure 9). Australia far outperformed other Indo-Pacific allies and partners on this measure: for example, New Zealand (53 per cent), Japan (50 per cent) and South Korea (47 per cent).
Figure 9. American views of countries: Australia seen more favourably than any other country
Question: Do you view ........ as an ally, friendly, unfriendly, or an enemy?
% of American respondents
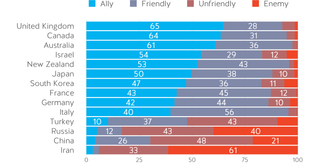
Political leanings had little impact on shaping American views of Australia’s relationship with the United States. Two-thirds of 2016 Trump voters described Australia an ally, compared to 61 per cent of Clinton voters (Table 1). This five percentage point gap between Trump and Clinton voters was dwarfed by the 18 point partisan difference in views about Canada, the 21 point difference with respect to Germany, the 27 point difference with respect to France and a 41 point difference with respect to Americans’ views of Israel as a partner.
Table 1. Little partisan difference in positive US view of Australia
American views of who is an ally, by 2016 US presidential vote
% of American respondents rating countries as an ally
|
|
All |
Clinton |
Other/Non-voters |
Trump |
Trump minus Clinton |
|
United Kingdom |
65 |
68 |
60 |
64 |
-4 |
|
Canada |
64 |
73 |
60 |
55 |
-18 |
|
Australia |
61 |
61 |
53 |
66 |
5 |
|
Israel |
54 |
36 |
42 |
77 |
41 |
|
New Zealand |
53 |
52 |
46 |
56 |
4 |
|
Japan |
50 |
50 |
50 |
49 |
-1 |
|
South Korea |
47 |
47 |
41 |
50 |
3 |
|
France |
43 |
59 |
33 |
32 |
-27 |
|
Germany |
42 |
53 |
39 |
32 |
-21 |
|
Italy |
40 |
41 |
36 |
41 |
0 |
|
Turkey |
10 |
6 |
19 |
11 |
5 |
|
Russia |
5 |
5 |
9 |
4 |
-1 |
|
China |
4 |
4 |
9 |
2 |
-2 |
|
Iran |
3 |
3 |
3 |
3 |
0 |
Trump’s criticisms of Canada, France and Germany, as well as the increasing politicised US-Israel relationship, are likely sources of these partisan differences.13 In a turbulent time for the American alliance network, Australia is one of the few countries more likely to be identified as an American ally by those who voted for Trump in 2016 than by those who voted for Clinton.
Australians also view the relationship with the United States positively. Six in ten Australians reported that the United States is an ally, only behind Australian assessments of New Zealand (73 per cent) and the United Kingdom (69 per cent) (Figure 10). A small proportion, seven per cent, described the United States as “unfriendly” (six per cent) or as an “enemy” of Australia (one per cent). Only two per cent of Australians provided negative ratings of New Zealand or the United Kingdom.
Figure 10. United States seen as one of Australia’s closest allies and friends
Question: Do you view ____ as an ally, friendly, unfriendly, or an enemy?
% of Australian respondents
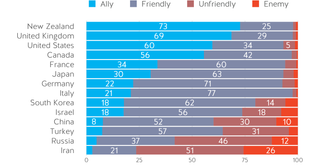
Unlike the broad consensus on Australia in the United States, Australian perceptions of the US-Australia relationship can vary according to personal politics. Two-thirds of Coalition voters labelled the United States an ally of Australia, compared to just 53 per cent of Labor voters (Table 2). This 14 percentage point partisan difference with respect to the United States is far and away the largest partisan split across the 14 countries put to Australian respondents, and unusual given the high overall rate of describing the United States as an ally. For other allies and partners such as New Zealand, the United Kingdom and Canada, there is virtually no gap between the rates at which Coalition and Labor voters identified those countries as allies of Australia.
Table 2. Australians more politically polarised on the US relationship than any other
Australian views of who is an ally, by 2019 House of Representatives vote
% of Australian respondents rating countries as an ally
|
|
All |
Coalition |
Labor |
Greens |
Coalition minus Labor |
|
New Zealand |
73 |
74 |
72 |
80 |
2 |
|
United Kingdom |
68 |
71 |
67 |
75 |
4 |
|
United States |
59 |
67 |
53 |
50 |
14 |
|
Canada |
55 |
57 |
54 |
64 |
3 |
|
France |
33 |
32 |
34 |
42 |
-2 |
|
Japan |
31 |
25 |
33 |
41 |
-8 |
|
Germany |
22 |
24 |
20 |
29 |
4 |
|
Italy |
21 |
21 |
25 |
15 |
-4 |
|
South Korea |
18 |
19 |
16 |
13 |
3 |
|
Israel |
18 |
22 |
17 |
6 |
5 |
|
China |
8 |
7 |
9 |
9 |
-2 |
|
Turkey |
8 |
7 |
7 |
10 |
0 |
|
Russia |
5 |
6 |
3 |
4 |
3 |
|
Iran |
3 |
4 |
3 |
2 |
1 |
The partisan nature of Australian perceptions of the US-Australia relationship may be heightened by the Trump administration.14 Divergent views in Australia on the issue of the US-Australia relationship have centred on US actions as a superpower, the unpopularity of the Vietnam and Iraq wars and the subsequent perception — voiced by former prime ministers Malcolm Fraser and Paul Keating — that Australian foreign policy can, at times, slavishly follow the United States to Australia’s detriment.
Two relationships with China
Perhaps the most important international issue confronting the United States and Australia concerns China’s strategic ambitions and assertiveness under Xi Jinping. How to balance the Chinese regime’s efforts to accrue power and extend influence is one of the most pressing challenges for Western democracies, and perhaps especially so for the US-Australia bilateral relationship.15
The Trump administration’s National Security Strategy and National Defense Strategy outlines a return to great power rivalry as the defining feature of contemporary international relations. These documents posit that China and Russia are seeking to assert their influence, “fielding military capabilities designed to deny America access in times of crisis … contesting our geopolitical advantages and trying to change the international order in their favor.”16 Across the US political spectrum, opinion writers and political leaders readily identify China as a strategic competitor or adversary, a rare moment of bipartisanship in US politics.17
Australia, too, has been engaged in its own strategic reassessments. Australian politicians and diplomats tend to use less robust language than their US counterparts when referring to Australia’s relationship with China.18
While many Australians understand the depth of Australia’s economic relationship with China, there is a growing wariness of the assertiveness and authoritarian character of the Chinese state
Nonetheless, there has been a shift in Australian sentiment towards China in both government circles and public opinion over the last few years.19 For instance, the Australian government’s 2017 Foreign Policy White Paper stressed that Australian foreign policy will give expression to freedom, liberal democracy and a rules-based international order. This is set against the end of the post-Cold War lull in major power rivalry, competition between China and the United States and challenges to the United States’ long dominance of world affairs.20 Since the publication of the White Paper, the Australian government: (a) enacted legislation to outlaw foreign interference and to heighten transparency around foreign influence in Australian politics and policy;21 (b) banned the Chinese firms Huawei and ZTE from Australia’s 5G network in August 2018;22 (c) as part of a partnership with the United States and Japan, funded a number of foreign aid projects designed — at least tacitly — to balance China’s growing presence in the Pacific islands and Southeast Asia.23
At the same time, the Australian public has learned of the extent of Chinese influence operations in Australia and around the region.24 So while many Australians understand the depth of Australia’s economic relationship with China — that China is Australia’s largest trading partner, that Australia runs a trade surplus with China, that Chinese demand for Australian commodity exports helped Australia weather the 2008 global financial crisis — there is a growing wariness of the assertiveness and authoritarian character of the Chinese state.
Economic dependence on China
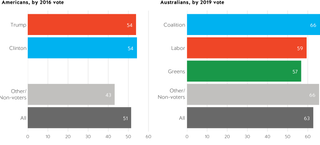
The economic relationships between China, the United States and Australia are of immense strategic significance, a source of both opportunity and vulnerability for the United States and Australia, but also a major source of differentiation in the way the United States and Australia approach China. Figure 11 shows that large percentages of respondents in both countries said their respective level of economic dependence on China is too high, with 51 per cent of US respondents and 63 per cent of Australian respondents having said that their country is too economically dependent on China.
On this question, there was none of the usual partisan differentiation typically seen among American respondents, with 54 per cent of both Trump and Clinton voters in agreement that the United States is too economically dependent on China. In Australia, on the other hand, Coalition voters were more likely than Labor voters to agree, 66 per cent to 59 per cent, with Greens at 57 per cent.
Figure 11. Little to no partisanship in US and Australian views of economic dependence on China: Majorities of Americans and Australians think their countries are too economically dependent on China.
Question: Do you think your country is too economically dependent on China?
% of respondents agreeing that their country is too economically dependent on China
Chinese investment
Both Americans and Australians preferred less investment from China in their respective countries to more investment (Figure 12). Forty-six per cent of Americans and 51 per cent of Australians wanted less investment from China in each country, while 19 per cent and 18 per cent preferred more.
Figure 12. Americans and Australians preferred less investment from China
Question: Would you prefer more, the same, or less investment into your country from ........
% of respondents
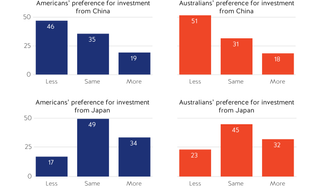
This was not the case for investment originating from other countries. More Japanese investment was preferred to less Japanese investment, with 34 per cent of Americans preferring more and 17 per cent less, and 32 per cent and 23 per cent of Australian preferring more and less respectively; and almost half the samples in both countries preferring the status quo. Similarly, more investment from Germany was preferred to less in the United States, 33 per cent to 18 per cent. Thirty-four per cent of Australians wanted more US investment in Australia, compared to 23 per cent who wanted less. These comparisons highlight that neither Americans nor Australians were hostile towards foreign investment per se but did have distinctly negative views about Chinese investment.
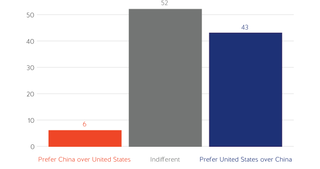
For each Australian respondent, their response on wanting more or less investment from China was compared with their response with respect to the United States (Figure 13). Most Australians (52 per cent) were indifferent between the United States and China as a source of foreign investment for Australia. But 43 per cent of Australians preferred more US investment than Chinese investment, while six per cent of Australians preferred more Chinese investment than US investment.
Figure 13. Australians are significantly more welcoming of investment from the United States than from China, but most are indifferent
Comparison of views about investment from the United States and investment from China
% of Australian respondents
US-China technological competition
Respondents in both the United States and Australia were asked if they agreed that “China has overtaken the United States as the world’s technological leader”; rates of agreement are presented in Figure 14.
Figure 14. Americans more optimistic about US technological prowess than Australians
Question: Has China overtaken the United States as the world’s technological leader?
% of respondents agreeing that China has overtaken the United States as the world’s technological leader
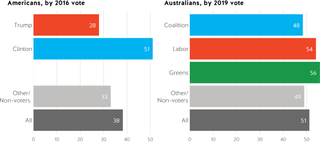
Americans were significantly less likely than Australians to agree that China surpassed the United States technologically, with 38 per cent agreeing versus 51 per cent of Australians who agreed. Only 28 per cent of Trump voters agreed with the proposition, dragging the overall level for the United States down, while Clinton voters held the same rate of agreement on the proposition among Australians, with 51 per cent agreeing that China leads the United States technologically. On the question explicitly querying US global leadership, the large partisanship in the American responses was not especially surprising: American respondents were, one could conject, at least in part projecting evaluations of the incumbent president into their responses. Australian respondents, on the other hand, had less at stake politically and emotionally in an explicit comparison of US and Chinese technological prowess, producing just a 6-point difference in rates of agreement between Labor voters (54 per cent) and Coalition voters (48 per cent).
The fact that the Australian responses clustered so neatly around the 50-50 point indicates that the proposition — that China has overtaken the United States as the world’s technological leader — was difficult to adjudicate, testing the limits of what Australians know about the matter, but also reflecting genuine uncertainty.
A new Cold War?
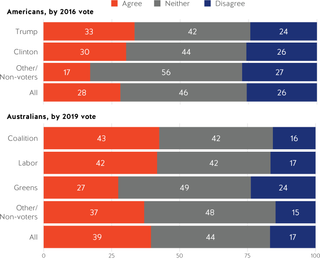
Australians were more likely to see the United States and China in a “new Cold War” than Americans, 39 per cent to 28 per cent (Figure 15). In the United States, Trump voters were the most likely to see the US-China relationship as a new Cold War (33 per cent), closely followed by Clinton voters (30 per cent). Major party voters in Australia were in lockstep on this matter, with 43 per cent of Coalition voters and 42 per cent of Labor voters in agreement that the US-China relationship is a new Cold War. Large proportions of respondents in both countries — between 40 per cent and 50 per cent — neither agreed nor disagreed, perhaps indicative of a lack of engagement with the issue.
Net levels of agreement in the United States were just two percentage points overall (28 per cent agree, 26 per cent disagree), and ranged from nine percentage points among Trump voters to four percentage points among Clinton voters; 56 per cent others and non-voters in the United States neither agreed nor disagreed that the United States and China are in a new Cold War, with disagreement leading agreement by ten percentage points.
Figure 15. Australians more likely to believe the United States and China are in a Cold War
Question: Are China and the United States in a Cold War?
% of respondents
Should Australia join the Belt and Road Initiative?
American and Australian respondents were also asked for their views about China’s Belt and Road Initiative (BRI), an ambitious international infrastructure project being carried out by the Chinese government. It was deemed unlikely that most respondents would know what BRI was, so some context was supplied before policy preferences about BRI were asked.
In both Australia and the United States, respondents were given a prompt:
The Belt and Road Initiative is a plan of the Chinese government to develop infrastructure and investments internationally. Some say the Belt and Road Initiative will create economic growth and raise living standards. Others say that the initiative is being used to extend China’s influence in other countries.
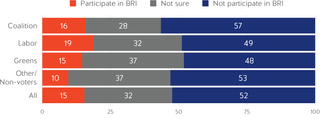
American respondents were then asked “Should America actively discourage its allies from participating in the initiative with diplomatic and economic pressure, or not interfere and let Chinese governments and companies build and own infrastructure in other countries?” Shown in Figure 16, just over half of American respondents were not sure if the United States should discourage US allies from participating in BRI. This rate fell to 45 per cent among Trump voters and 50 per cent among Clinton voters. Thirty-eight per cent of Trump voters said that the United States should discourage allies from participating in BRI while 20 per cent of Clinton voters thought similarly.
Overall, just one in four Americans believed that the United States should discourage its allies from participating in the BRI, and 23 per cent said that the United States should not discourage its allies from BRI participation. A preference for discouraging allies led not discouraging among Trump voters by 20 percentage points (38 per cent to 18 per cent), while not discouraging led discouraging allies by ten percentage points among Clinton supporters, 20 per cent versus 30 per cent.
Australian respondents were asked if Australia should join BRI and “allow Chinese governments and companies to build and own infrastructure in Australia”. Only 15 per cent of Australians said that Australia should join BRI, with a slightly higher proportion of Labor supporters in favour (19 per cent) than other segments of the population. Roughly a third of Australians were unsure about whether Australia should participate in BRI, with little partisan variation (28 per cent Coalition, 32 per cent Labor, 37 per cent Greens). A majority (52 per cent) said that Australia should not join BRI, rising to 57 per cent among Coalition supporters and falling to 49 per cent among Labor voters and 48 per cent among Green voters. Not participating in BRI led participating by 37 percentage points overall (52 per cent to 15 per cent), rising to 41 points among Coalition voters, 43 points among supporters of minor parties and non-voters and falling to 30 points among Labor voters.
Figure 16. Australians more opinionated than Americans concerning China’s Belt and Road Initiative
Question: The Belt and Road Initiative is a plan of the Chinese government to develop infrastructure and investments internationally. Some say the Belt and Road Initiative will create economic growth and raise living standards. Others say that the initiative is being used to extend China’s influence in other countries.
Rest of question to American respondents: Should the United States discourage allies from participating in the Belt and Road Initiative?
% of respondents, by 2016 vote25

Rest of question to Australian respondents: Should Australia participate in the Belt and Road Initiative and allow Chinese governments and companies to build and own infrastructure in Australia?
% of respondents, by 2019 vote
Approval of US efforts to handle China
Under the Trump administration, the United States is pursuing a tougher set of policies towards China. Tariffs on Chinese imports to the United States are the most prominent and controversial aspect of this policy. But the Trump administration is also seeking concessions from China on intellectual property issues and Vice President Pence and senior Cabinet secretaries are vocal critics of China’s persecution of ethnic minorities, censorship and mass surveillance of its own people and “malign influence and interference in American politics and policy.”26
Under the Trump administration, the United States is pursuing a tougher set of policies towards China. Tariffs on Chinese imports to the United States are the most prominent and controversial aspect of this policy.
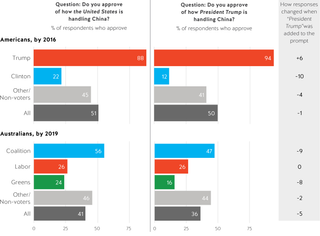
Extensive commentary and analysis has sought to distinguish elements of US policy towards China that are specific to Trump and his administration, versus what might be reflective of a broader shift in American thinking and policy towards China. This distinction was probed with a question-wording experiment, in which respondents are asked if they approved or disapproved of (a) how President Trump is handling China, or (b) how the United States is handling China.
In the United States, overall approval levels of the way the United States is handling China did not respond to the variation in question-wording, with approval levels of around 50 per cent (see Figure 17). But behind that overall data was polarised partisanship. When asked about how the “United States is handling China”, 88 per cent of Trump voters and 22 per cent of Clinton voters approved — a partisan differential of 66 per cent. When “President Trump” was the subject of the question, Trump voter approval increased six points to 94 per cent and Clinton voter approval dropped to just 12 per cent, producing a partisan differential of 82 points.
Australians were less approving of how the United States — or Trump — is handling China. Forty-one per cent of Australians approved when the subject was “the United States”, which fell to 36 per cent when the subject changed to “President Trump”. There was a stark partisan gradient between Coalition and Labor voters, with 56 per cent to 26 per cent (a 30 point difference) approving of how the United States is handling China. This fell to 47 per cent to 26 per cent differential (21 points) in the “President Trump” form of the question.
Figure 17. Survey experiment: Americans are more approving — but more polarised — of US policy towards China
Trade and tariffs
In July 2018, the United States and China each imposed tariffs on US$34 billion-worth of the other country’s exports. Beijing’s retaliation to the original US tariffs prompted the Trump administration to formally announce an additional US$200 billion-worth of Chinese goods to impose tariffs of ten per cent.27 This appears to have been the beginning of a trade war between the world’s two largest economies.
Both sides have threatened to respond to each other’s trade barriers as they are imposed, and so far they have mostly followed through with these threats despite occasional and seemingly ephemeral respites.
US tariffs were not only applied to China, but also to allies across the US border, in Europe and East Asia.28 Australia sought and was granted exemptions from the Trump administration’s steel and aluminium tariffs, but these are only temporary.29
In the opening days of these trade confrontations, President Donald Trump said he was confident the United States would come out on top. The president insisted trade wars are ‘good, and easy to win’, that the United States has nothing to lose from taking a confrontational approach to China on trade, and that there was far more upside to his approach than downside.30
Figure 18. Survey experiment: Australians more optimistic about benefits of tariffs on US economy than Clinton voters
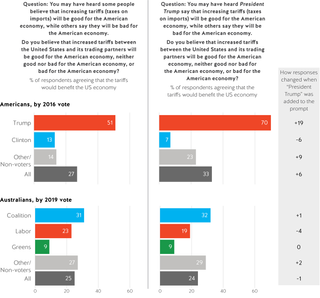
To assess the effect President Trump’s involvement has on public opinion towards tariffs, half of the survey respondents were given a “treatment”. This means that a random half of the sample in both countries were prompted with a question that said President Trump was in favour of tariffs while the other half were prompted with a question that said “some people” were in favour of tariffs.
Americans and Australians appeared sceptical of the benefits that tariffs will have for the US economy, regardless of whether they are specifically tied to President Trump. Just 27 per cent of Americans in the control group (without the Trump prompt) said they were good for the economy, while 42 per cent said they were bad for the economy. The American treatment group was slightly more positive (driven by an increase in Republican support when Trump is mentioned).
Americans and Australians appeared sceptical of the benefits that tariffs will have for the US economy.
The Trump treatment had little impact on Australian attitudes; primarily serving to reduce the proportion of respondents neither believing they would be good or bad for the economy (by nine points), and increasing those who said they were bad (by eight per cent). Most of this movement was from Greens and Labor voters.
Trump voters in the United States were significantly affected by the mention of President Trump, with the support of Trump voters in favour of tariffs jumping 19 per cent when it is mentioned that President Trump is in favour of them.
Clinton voters were more likely to think the opposite when President Trump was mentioned, but to a lesser extent. A similar, though statistically insignificant, partisan gap appears in the Australian control group too.
Regardless of the partisan dynamics, these results suggest most Americans and Australians are sceptical of the benefits of tariffs.
Foreign interference and influence
Foreign influence has dramatically come to prominence in the political discourse in both the United States and Australia in recent years, but for different reasons. In Australia, the concern is the susceptibility of its politicians to coercion from its largest trading partner, China. In the United States, the larger (though highly partisan) concern is now the manipulation of elections by Russia.
The Australian public is clearly most worried about China. Nearly two-thirds of Australian respondents said they were concerned about Chinese influence (Figure 19). Only 21 per cent said they were not concerned. This was bipartisan, as 60 per cent or more Coalition, Labor and Greens voters said they were concerned.
While a majority of Americans were also concerned about Chinese influence in their own country, at 56 per cent this concern was slightly lower than in Australia. Americans were generally more worried about Russian interference.

This concern is not unfounded. In January 2017, the US Office of the Director of National Intelligence assessed that Russian President Vladimir Putin orchestrated a campaign designed to harm the electoral chances of Democratic candidate Hillary Clinton, faith in the US electoral system, and increase political instability in the United States.31
Since President Trump’s inauguration, these questions over the extent of the contact between his campaign and Russian government agents has loomed over his presidency.
Overall, most US respondents were worried about this. Figure 19 shows that 64 per cent of Americans said they were concerned about Russian interference. There was less partisan consensus among the American public on this matter than can be observed on China in Australia. Eighty per cent of Hillary Clinton voters were concerned about Russian interference. While a majority of Trump voters were also worried, this rate was much lower (56 per cent). Trump voters were actually almost as concerned about interference from Mexico as they were about potential Russian malfeasance.
Figure 19. Foreign interference: Australian concern over US interference in Australian politics a partisan issue
Question: Are you personally concerned or not concerned about the influence of ........ on your country’s political processes?
% of respondents who are concerned
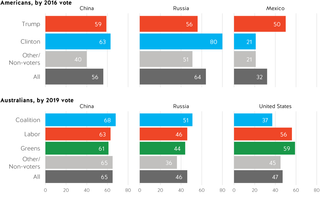
While 46 per cent of Australians were also concerned about Russian interference, the partisan pattern here was the opposite of the United States, with Coalition voters slightly more worried than Greens or Labor supporters. Australians were slightly more concerned about American interference in the political processes than Russian interference, with 47 per cent concerned about American influence. This mostly came from Labor (56 per cent) and Greens voters (59 per cent). However, 37 per cent of Coalition supporters were also concerned about American interference.
Media consumption
In both the United States and Australia, the news media is commonly referred to as the Fourth Estate. This is derived from its (unofficial) role as a check on the executive, legislative and judicial branches of government, and its capability to cover and frame political issues.
Though this role as a watchdog is not formally recognised as part of the system of government in either country, the news media wields significant influence. A free politically unbiased press, seeking and exposing the truth, has long been considered by both Australians and Americans to be an essential component of representative democracy.
The greater partisan differences that can be observed on a range of issues in the United States compared with Australia may be explained by (or in some way related to) a more partisan media environment.
However, beginning with the deregulation of media in the United States during the 1980s, and the rise of new news media during the following decades, the partisanship of news media has increased dramatically in the United States and Australia.
This change is significant. The stories the media decides to tell, who it decides to talk to and about, shape the way many citizens understand politics and policy. In large and complex societies, time and attention are finite, while political and policy issues are complicated. By selecting to report certain stories or providing an ideological slant, the media is influential in setting the agenda.
The greater partisan differences that can be observed on a range of issues in the United States compared with Australia may be explained by (or in some way related to) a more partisan media environment. To understand this better, respondents in the United States and Australia were asked about their media consumption habits.
Consumption of news media in Australia and the United States
To obtain a measure of media consumption in both countries, respondents were asked whether they had used a range of offline and online media sources in the past week.
Shown in Figure 20, American respondents indicated that while broadcast news (like ABC, CBS, NBC) is important, cable news channels like Fox News and CNN are also important, with CNN Online also being a common source of news. Shown in Figure 21, Australian survey respondents generally said that they received their news from public broadcasters, such as ABC or SBS, and major commercial free-to-air television channels including Channel 7 and Channel 9.
This prominence of cable news in the United States is crucial to note, as cable news tends to be more polarised along party lines in both countries, while network television news tends to be less partisan.
Figure 20. Media consumption in the United States, by 2016 US presidential vote
Question: Which of the following media have you used to access news offline in the last week (via TV, radio, print, and other traditional media)?
% of respondents (respondents were provided with a list of options and were able to select all that applied)
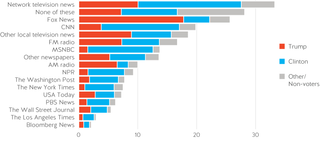
Question: Which of the following media have you used to access news online in the last week (via websites, apps, social media, and other forms of internet access)?
% of respondents (respondents were provided with a list of options and selected all that applied)

Figure 21. Media consumption in Australia, by 2019 House of Representative vote
Question: Which of the following media have you used to access news offline in the last week (via TV, radio, print, and other traditional media)?
% of respondents (respondents were provided with a list of options and selected all that applied)
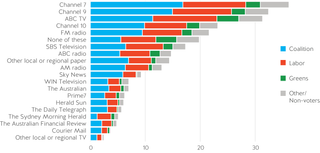
Question: Which of the following media have you used to access news online in the last week (via websites, apps, social media, and other forms of internet access)?
% of respondents (respondents were provided with a list of options and selected all that applied)

A majority of respondents in both countries were simply not engaged in the news cycle at all. Approximately 20 per cent of Australians and almost 30 per cent of Americans did not consume any of the traditional media outlets listed. Australians were less likely to say they use any of the online media we asked about, with 40 per cent selecting none of the potential choices, compared with a little over 35 per cent of Americans.
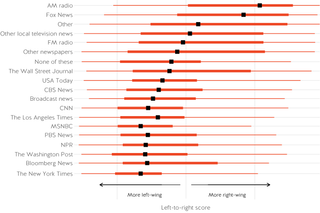
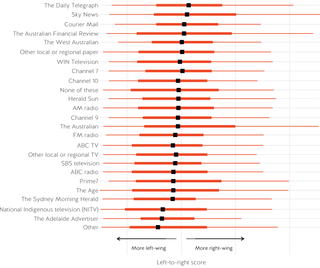
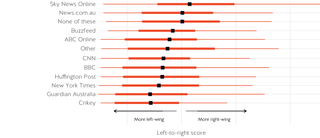
A majority of respondents in both countries generally accessed multiple offline media sources, though, while many used just one or two websites for online news. Americans were slightly more likely to use fewer media sources. This is consistent with the greater polarisation of American media consumption. While self-reported audiences of the most popular offline US media outlets had strong partisan leanings (Fox News, Trump voters; CNN, Clinton voters) most of the major offline Australian media outlets had relatively balanced audiences. A similar pattern was observed online.
On the whole, the partisanship in the United States on this issue dwarves that of Australia’s. To quantify just how polarised the media diets are, a “left to right” scale was applied to determine the political identity of each media outlet’s consumers (see appendix to learn how political leanings were determined). Shown in Figure 22, this exercise quickly identifies the significant divide in the political spectrum in the United States. The contrast is made all the starker by how much overlap exists in the Australian case (Figure 23) — where even media with the most partisan audiences, left (National Indigenous Television) or right (The Daily Telegraph), shared significant overlap.
Figure 22. US media consumption is politically polarised
Ideological positions of voting blocs, United States and Australia, based on factor analysis of seven items on inequality and state intervention. Points indicate medians of the resulting scale measure; thick lines indicate 25th to 75th percentiles; thin lines extend to 10th and 90th percentiles.
a. Left-right scores of consumers of selected US print and broadcast news outlets
b. Left-right scores of consumers of selected US online news outlets
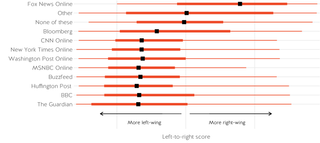
Figure 23. Australian media consumption: Less partisan and less polarised
Ideological positions of voting blocs, United States and Australia, based on factor analysis of seven items on inequality and state intervention. Points indicate medians of the resulting scale measure; thick lines indicate 25th to 75th percentiles; thin lines extend to 10th and 90th percentiles.
a. Left-right scores of consumers of selected Australian print and broadcast news outlets
b. Left-right scores of consumers of selected Australian online news outlets
Gun control
One of the starkest cultural differences between Australia and the United States is the culture of gun ownership in both countries.
After 35 people were killed in the Port Arthur Massacre in 1996, the conservative Howard government enacted a near-total prohibition on semi-automatic weapons, made the process of buying a gun significantly more difficult and initiated a gun amnesty and buyback scheme to remove the newly-illegal weapons from circulation.
In the wake of mass shootings in the United States over the last two decades, a question that often follows is “why can’t the United States enact Australian-style gun control?”
In the wake of mass shootings in the United States over the last two decades, a question that often follows is “why can’t the United States enact Australian-style gun control?” In the United States, gun reform measures have often faltered in Congress, despite recent mass movements like the student-led ‘March for Our Lives’ initiative.
Survey respondents indicate significant partisan divisions that exist in the United States on the issue of guns, but also strongly indicate more willingness for gun control than Congress has been able to legislate.
Home of the free and land of the brave, or a more complicated story?
The resistance to attempts by successive US administrations and congress to restrict gun ownership (with the now-expired Clinton administration assault weapons ban, a notable exception) is often attributed to the frontier spirit of the American people: their libertarian streak that prefers small government and individual freedom, even if it comes at a cost.
The truth appears to be more complicated.
The collected data indicates that public attitudes towards which directions Australians and Americans want their respective governments to move on gun control are actually similar. It should be noted, however, that the policy status quo each is responding to is different.
Therefore the 93 per cent of Australians who said they want access to firearms to be harder, or remain the same, can all be considered to support stricter gun control measures in Australia than exist in the United States.
Figure 24. Nine in ten Australians in favour of stricter gun control in Australia: Just over half of Americans want to make guns more difficult to obtain
Question: Do you think the government in your country should make guns ........?
% of respondents
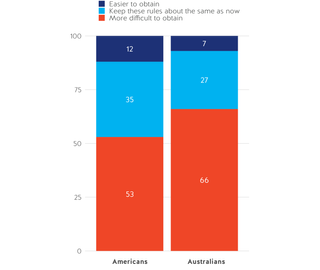
A slim majority of American respondents wanted to make it harder to own firearms, not easier. Shown in Figure 24, just seven per cent of Australians and 12 per cent of Americans said they wanted their federal government to make it easier for people to buy a gun, while 66 per cent of Australians and 53 per cent of Americans wanted it to be harder to buy a gun in their own countries.
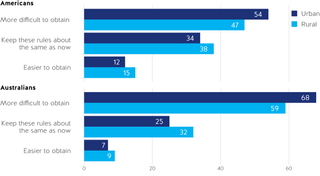
This is generally equal across rural and urban areas. As can be seen in Figure 25, just 15 per cent of rural American respondents said they wanted guns to be easier to obtain, while 47 per cent wanted them to be harder to get. The figures for urban Americans were 12 per cent and 54 per cent, respectively.
Figure 25. Rural versus urban: Most rural Australians want already strict Australian gun control to be even stricter
Question: Do you think the government in your country should make guns ........?
% of respondents agreeing
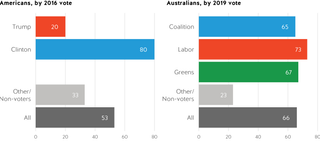
One area that differentiated Australians and Americans on the issue of which direction they wanted their government to move on guns was partisanship. Coalition, Labor and Greens voters were all roughly opposed to making guns easier to obtain in Australia, with fewer than ten per cent of the supporters of each party preferring this option and the differences between them being within the margin of error. Shown in Figure 26, a large majority of each party’s supporters preferred making guns more difficult to obtain; 73 per cent of Labor voters favoured this option, compared with 65 per cent of Coalition supporters.
In the United States, the partisan split was much larger. While 80 per cent of respondents who voted for Hillary Clinton in 2016 supported making it harder to obtain firearms, just 20 per cent of Trump voters agreed. A difference of 60 per cent and seven times the size of the partisan gap in Australia. Even still, only approximately 21 per cent of Trump voters wanted guns to be easier to obtain, compared with six per cent of Clinton supporters.
Figure 26. Gun control: Little partisanship in Australia, extreme partisanship in the United States: Few issues are more politically divisive in the United States
Question: Do you think the government in your country should make guns ........?
% of respondents who think guns should be more difficult to obtain
#metoo
While sexual harassment has always been a serious problem, its salience as a public issue increased substantially with the emergence of the #MeToo movement in 2017. The movement protests the widespread prevalence of sexual assault and harassment: particularly (but not only) in the workplace.
Attitudes about harassment in Australia and the United States
To understand wider public attitudes about sexual harassment and assault in the United States and Australia, our respondents were asked whether the following issues were a major problem, a minor problem, or not a problem at all:
- Men getting away with committing sexual harassment and assault.
- Women making false claims about sexual harassment or assault.
- Women not being believed about sexual harassment and assault.
Overall, survey respondents indicated very little difference between the United States and Australia. Majorities in both countries believed men getting away with sexual harassment and assault was a major problem (67 per cent in Australia, 64 per cent in the United States), while very few believed this is not a problem at all (five and eight per cent, respectively) (Table 3). Most also said women not being believed was a major problem (57 per cent in Australia, 54 per cent in the United States), while relatively few thought this was not a problem (ten and 14 per cent).
Table 3. Attitudes towards sexual harassment and assault
Question: Do you agree that ........ is ........?
% of respondents who thought ........ is ........
|
|
Americans |
Australians |
Difference |
|
Men getting away with committing sexual harassment and assault |
|||
|
A major problem |
64 |
67 |
-3 |
|
A minor problem |
28 |
28 |
0 |
|
Not a problem |
8 |
5 |
3 |
|
Women making false claims about sexual harassment and assault |
|||
|
A major problem |
44 |
41 |
3 |
|
A minor problem |
40 |
47 |
-7 |
|
Not a problem |
16 |
12 |
4 |
|
Women not being believed about sexual harassment and assault |
|||
|
A major problem |
54 |
57 |
-3 |
|
A minor problem |
32 |
34 |
-2 |
|
Not a problem |
14 |
10 |
4 |
However, a large number of respondents also said women making false claims about sexual harassment and assault was a major problem (41 per cent in Australia and 44 per cent in the United States); with relatively few saying this was not a problem at all (12 and 16 per cent, respectively).
Many respondents believed that sexual harassment is a problem but also said women making false claims is also a concern. Nearly half of respondents in both countries who said women not being believed is a major problem also said women making false claims is an issue. This could be a result of the perception that a false claim undermines the legitimacy of real claims and leads to more difficulty for genuine victims.
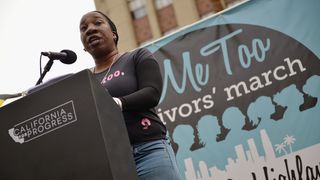
Responses about sexual harassment and assault vary by gender in both Australia and the United States. The only item that Australian men were more likely to say was a major problem was women making false accusations (Figure 27). Approximately three-quarters of women in both countries believed men getting away with sexual harassment and assault is a major problem, about two-thirds of women in both countries thought women not being believed is a significant issue, and less than half of women in both countries thought that women making false accusations is a worry. Conversely, just over half of men in both countries thought men getting away with harassment and assault is a major concern, less than half that women not being believed is a problem and almost half that women making false accusations is an issue.
The similar views between the two countries on the topic masked a significant partisan divide. As can be seen in Figure 27, Clinton voters on average expressed more concern about sexual harassment than Labor voters, while Trump voters were generally less concerned than their Coalition counterparts in Australia. This ultimately led to the average responses for the entire countries to be similar but, once again, the United States is significantly more politically polarised than Australia.
Figure 27. Australian partisan divide on sexual harassment and assault much smaller than US partisan divide
Question: Do you agree that ........ is a major problem?
% of respondents who agree ........ is a major problem
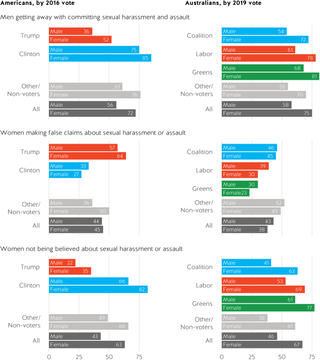
Abortion
The debate over legal access to abortion has been very prominent in the United States for decades and spiked in political importance in some Australian states in recent years.
Generally, abortion was not a highly salient issue in Australian politics. However, in 2018 abortion was decriminalised in Queensland and in late 2019, the New South Wales (NSW) state parliament passed the Reproductive Health Care Reform Bill 2019 after considerable, often heated, debate.32 This bill brought the state laws of Queensland and NSW in line with other Australian states and removed abortion from the criminal code.
In the United States, abortion has remained a contentious topic and prominent source of debate since 1973, when the United States Supreme Court decided on the Roe v Wade case. This landmark ruling defined a pregnant woman’s liberty to choose to have an abortion in the United States without excessive government restriction.
But where the Australian legislative debate has largely centred on whether to loosen restrictions to access abortion services, many American states are looking at (or have started) introducing legislation limiting access.33 Additionally, the Trump administration’s appointments of a number of conservative judges to US appellate courts, and Justices Gorsuch and Kavanaugh to the Supreme Court have created a possible path for a successful conservative challenge to Roe v Wade.34

Australians mostly believe abortion a matter of personal conscience, Americans are more divided
Broadly speaking, our survey respondents indicated that a majority of Australians were supportive of women being able to obtain an abortion as a matter of personal choice, regardless of context (Figure 28). This is less the case in the United States, where the public was more divided. Fifty-eight per cent of Australian respondents supported unrestricted access to abortion, compared with 42 per cent of Americans.
Americans were more likely to believe abortion should only be permitted in case of rape, incest, or when the woman’s life is in danger (26 per cent in the United States compared with 16 per cent in Australia) and that it should never be permitted (13 per cent in the United States and five per cent in Australia).
Figure 28. Americans more conservative on abortion than Australians
Question: In what instances should abortion be legal?
% of respondents agreeing
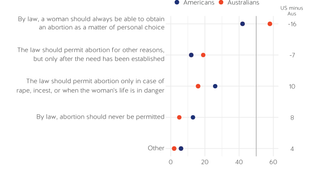
Women and men hold similar attitudes
In both countries, there was only a very small difference between women and men, displayed in Figure 29.
Women in Australia and the United States were slightly more likely to believe that women should be able to obtain an abortion as a matter of personal choice, but no less likely to have said it should never be permitted. In both countries, this gap was of a similar size. In Australia, women were approximately seven per cent more likely than men to say abortion should always be a matter of personal choice, and in the United States, women were seven per cent more likely than men to do so.
Figure 29. On abortion, Clinton voters more progressive than Labor voters; Trump voters more conservative than Coalition voters
Question: In what instances should abortion be legal?
% of respondents agreeing that, by law, a woman should always be able to obtain an abortion as a matter of personal choice
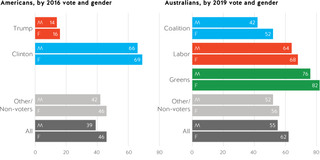
Partisan gap larger in America than Australia
In Australia, two-thirds of Labor voters supported unrestricted rights for women to obtain abortions, while 47 per cent of Coalition voters held the same view; a gap of 19 per cent. Only about three per cent of Labor voters and seven per cent of Coalition supporters wanted to ban abortions entirely.
In the United States, only 15 per cent of Trump voters believed that a woman should be able to obtain an abortion as a matter of personal choice, compared with 68 per cent of Clinton voters; a gap of 53 per cent. Conversely, more Trump voters supported a total ban on abortions than want women to have unrestricted access, with 22 per cent having said they should never be permitted, while only three per cent of Clinton voters hold this view.
Religion is a major driver
In both countries, religion was a major driver for opposition to a woman always being able to obtain an abortion as a matter of personal choice.
While approximately three-quarters of Australians with no religion supported free choice for women, fewer than half of Christian respondents agreed (Table 4). However, even among those who identified as religious, only around ten per cent believed abortion should be completely banned, with many believing it should be restricted to exceptional circumstances or required the need to be established beforehand.
In the United States, support for a complete ban was higher. However, even here, only around 20 per cent of those part of traditionally anti-abortion groups, those identifying as Protestant or other Christians, supported a complete ban. This indicates that even among those identifying as religious, there is support for women to be able to access abortion services in limited circumstances.
Table 4. US and Australian views on abortion, by religion: US religionists and non-religionists both more conservative than Australian counterparts
Question: In what instances should abortion be legal?
% of respondents agreeing, by religion
|
Australia |
No religion |
Other |
Catholic |
Protestant |
Other Christian |
|
By law, a woman should always be able to obtain an abortion as a matter of personal choice |
74 |
51 |
48 |
47 |
38 |
|
The law should permit abortion for other reasons, but only after the need has been established |
14 |
22 |
23 |
23 |
17 |
|
The law should permit abortion only in case of rape, incest, or when the woman’s life is in danger |
8 |
19 |
20 |
20 |
33 |
|
By law, abortion should never be permitted |
2 |
7 |
7 |
7 |
11 |
|
Other |
2 |
2 |
2 |
2 |
1 |
|
|
|
|
|
|
|
|
United States |
No religion |
Other |
Catholic |
Protestant |
Other Christian |
|
By law, a woman should always be able to obtain an abortion as a matter of personal choice |
62 |
46 |
34 |
31 |
29 |
|
The law should permit abortion for other reasons, but only after the need has been established |
12 |
16 |
15 |
12 |
10 |
|
The law should permit abortion only in case of rape, incest, or when the woman’s life is in danger |
14 |
24 |
35 |
31 |
34 |
|
By law, abortion should never be permitted |
6 |
5 |
12 |
18 |
23 |
|
Other |
6 |
8 |
4 |
8 |
4 |
Climate concerns
Majorities of American and Australian survey respondents said climate change is occurring; it is at least partially caused by human activity; it will have a severe impact on wildlife, water supplies and the weather; and their country should take action to reduce the use of fossil fuels for energy production.
As with many issues examined in this report, much of the difference between Australian and American attitudes towards climate change was driven by respondents who voted for Donald Trump in 2016. These respondents were the only group among whom a majority either said they did not know if climate change is happening (19 per cent) or said that they did not believe climate change is happening (34 per cent). Among Trump voters who did say climate change is happening, only one in five said that climate change is mostly caused by human activity. In Australia, nearly 71 per cent of Coalition voters said climate change is happening and nearly half of that group said it is mostly caused by human activity.
Figure 30 makes clear that Australians were more likely to agree that climate change is occurring than Americans, but this was a majority proposition in both countries (77 per cent in Australia, 68 per cent in the United States). Australians who voted for the Coalition in the 2019 election were less likely to believe climate change is occurring (71 per cent) than Labor supporters (84 per cent). In the United States, the partisan difference was larger. Only about half of those respondents who voted for Donald Trump in 2016 (49 per cent) said climate change is occurring, compared with 84 per cent of respondents who voted for Hillary Clinton.
Figure 30. On average, Americans are more sceptical about climate change than Australians
Question: Is climate change occurring? If so, what do you think is causing it to occur?
% of respondents who believe climate change is occurring, by country
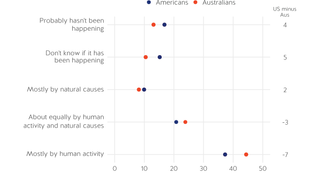
Forty-five per cent of Australians and 37 per cent of Americans who said climate change is occurring said they believe climate change is mostly caused by human activity (Figure 30). Twenty-one per cent of Americans and 24 per cent of Australians said it is caused by an equal mix of human and natural causes, while eight per cent of Australians and ten per cent of Americans who said climate change is occurring said it is mostly caused by natural causes. This means that approximately 69 per cent of Australians and 58 per cent of Americans said that climate change is both occurring and caused at least partially by human activity.
Figure 31. Minor Australian political divide on climate change dwarfed by US political divide
Question: Is climate change occurring? If so, what do you think is causing it to occur?
% of respondents who believe climate change is occurring, by vote
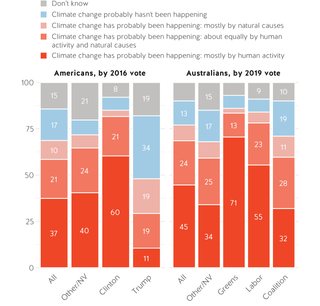
A tax on carbon
Not only did most Australian respondents say that climate change is occurring and mostly or partially caused by human activity, they also said they want to see action to reduce fossil fuel use.
Figure 32 indicates that the vast majority of Australians (78 per cent) supported action to reduce fossil fuel use. In the United States, support for reducing fossil fuel use was slightly lower, but still a majority (68 per cent).
Not only did most Australian respondents say that climate change is occurring and mostly or partially caused by human activity, they also said they want to see action and reduce fossil fuel use.
A survey experiment was conducted in order to test whether respondents in the two countries wanted to reduce fossil fuels in general or specifically implement a carbon tax. In the experiment, one-half of respondents were asked whether they supported undefined plans to reduce reliance on fossil fuels while the other half were asked whether they supported a plan that would raise taxes on carbon emissions in order to reduce reliance on fossil fuels.
Support dropped significantly in both countries when respondents were asked whether they would support reducing fossil fuel use through a carbon tax. The right-hand column of Figure 32 highlights that in Australia, the treatment (mentioning tax increases) led to a decline in support of 14 per cent. In the United States, a similar decline of 14 per cent occurred. In both countries, a majority of respondents still favoured a plan that would reduce fossil fuel use. In Australia, 64 per cent of respondents supported such a plan to be paid for by raising taxes, including a tax on carbon emissions. Fifty-four per cent of Americans also supported a carbon reduction plan that involved tax increases.
Figure 32. Survey experiment: Clinton voters more progressive on fossil fuels than Labor voters
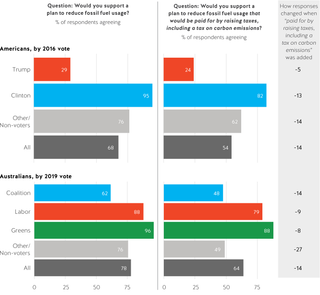
As with other issues, public opinion was far more divided along partisan lines in the United States. Shown in Figure 32, almost half of Coalition voters in Australia said they support a carbon tax, as did 79 per cent of Labor voters. Among Americans, only 24 per cent of Trump voters supported raising taxes for a carbon emissions plan, compared with 82 per cent of Clinton supporters.
Partisan differences were also observed in the treatment effects. Support for a plan to reduce fossil fuel use declined more among all voters when it was tied to a tax increase, but this varied by country and political affiliation. In Australia, support among Labor voters for reduced fossil fuel use declined by nine per cent when tied to tax increases, while for Coalition voters, it dropped by 14 per cent. The largest reduction in Australian support was among voters who supported minor parties or did not vote at all (27 per cent).
Different patterns were observed in the United States. Support for reduced fossil fuel use declined more for Clinton voters by 13 per cent when tied to tax increases. Trump voters declined by five per cent although the latter was coming off a much lower base.
These results suggest voters wanted action, but that tying this action to taxes reduces support to a degree. Nonetheless, majorities in both countries still said they prefer action — even if it means a tax on carbon emissions — because climate change is seen as a serious problem.
The implications of climate change
Seventy per cent of Australians said that harm to wildlife and habitats is an extremely or very likely outcome of climate change while just six per cent said it was not at all likely and another seven per cent said slightly likely. Similarly, 70 per cent of Australians said that it is very or extremely likely that climate change will cause more droughts and water shortages. Six per cent of Australians said it was not at all likely and another seven per cent said slightly likely.

Australian concern about an increase in the chances that storms would become more severe as a result of climate change was lower. Sixty-four per cent of Australians said this was very or extremely likely. Eight per cent said it was not at all likely and another eight per cent said slightly likely.
Consistent with the slightly lower rate of American agreement that climate change was occurring and caused by human activity, fewer US respondents said it was likely that climate change would have significant effects on the environment.
Across each of the three questions on the implications of climate change, approximately 60 per cent of US respondents reported that it was very or extremely likely that shifts in the climate would cause harm to wildlife and habitats, increase droughts and water shortages or more severe storms.
Figure 33. Partisan polarisation on climate change consequences smaller in Australia than in the United States
Question: Do you believe climate change will cause ........?
% of respondents who say the possibility of each of these being impacted by climate change was extremely or very likely
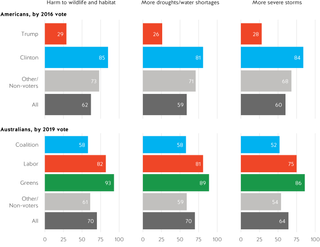
Differences between the United States and Australia largely driven by differences between Coalition and Republican voters
Americans who voted for Hillary Clinton in 2016 resembled Labor voters at the 2019 Australian election on this issue. Supporters of the Labor and Greens parties in Australia, and Clinton voters in the United States were overwhelmingly of the opinion that climate change is occurring and supportive of plans to reduce fossil fuel use (even if it means new taxes). In Australia, centre-right Coalition voters were only moderately more sceptical of human contribution to climate change than Labor and were split fairly evenly on plans to reduce fossil fuels (more in favour when taxes weren’t mentioned). A small majority of Coalition identified harm coming from climate change.
As with some of the other issues examined in this report, much of the difference between Australians and Americans was driven by the beliefs and attitudes of Trump voters towards climate change.
Race, politics and prejudice
Australia and the United States both carry legacies of European colonisation, centuries of institutionalised racism and the systematic dispossession of indigenous peoples. These legacies are no mere historical curiosities. In both countries, poverty and inequality continue to be profoundly shaped by race and ethnicity. Racial inequality — recognising it as a legitimate subject of public policy, and debates as to how to address it — is a significant source of political division in both countries. Immigration has long been a driver of population growth, economic expansion, ethnic and cultural diversity and political controversy in both Australia and the United States. Accordingly, any serious survey of public opinion in either country has to take stock of the way race structures politics and the contemporary political significance of racial prejudice.
Race is a significant political cleavage in the United States in two key respects. First, voting coalitions cohere around race and ethnicity much more powerfully than they do in Australia. Second, among White voters, attitudes about race strongly predict whether one votes for Democratic or Republican candidates, or for the Coalition or other parties in Australia.
Race as a political cleavage
In 2016, as has been the case in every presidential election since 1968, a majority of White voters supported the Republican candidate for president.35 In this survey’s data, Trump won the White vote 57-43, with Whites comprising 72 per cent of the electorate. Democrats had lop-sided support among the two largest non-White segments of the electorate, with Clinton beating Trump 89-11 among African-Americans (13 per cent of the electorate) and 70-30 among Hispanics (ten per cent of the electorate). White Americans are the single largest racial group in the electorate by a comfortable margin. Nonetheless, extremely strong support for Democrats in the non-White electorate means that while Trump won 57 per cent of the two-party vote among Whites, the overall level of support for Trump is 48.5 per cent in the total electorate. Trump, of course, won the presidency by winning the Electoral College, not the “popular vote”, in no small measure due to the profound geographic concentration of the non-White, Democratic-voting population.
US electoral politics is far more polarised along race and ethnicity than Australian electoral politics.
Figure 34 shows the relationship between (a) race/ethnicity and two-candidate vote shares in the 2016 US presidential election and (b) ancestry and two-party vote shares in the 2019 election to the Australian House of Representatives. Each panel is partitioned into vertical strips corresponding to race/ethnicity (United States) or ancestry (Australia); in the interest of simplicity, this analysis is restricted to respondents reporting voting for either Trump or Clinton (United States) or Labor or the Coalition (Australia)
Voting in Australia is not nearly so polarised along race and ethnic lines. Among the largest ancestry group, those reporting European or Australian ancestry, political support cleaved 54-46 Coalition-Labor, closer to 50-50 than the 57-43 Trump-Clinton split observed among American Whites.
In short, US electoral politics is far more polarised along race and ethnicity than Australian electoral politics. Furthermore, in the absence of compulsory turnout in the United States, the racial and ethnic composition of the electorate in any given election is not merely a function of demography, but of who decides to vote. Precisely because the US electorate is racially polarised, this creates powerful incentives for politicians to make appeals to racial and ethnic identity when courting voters, reinforcing the political salience of race and ethnicity in US politics.36
Figure 34. Primary US political parties are far more racially polarised than Australian parties
Two-party vote, by race/ethnicity (United States) or ancestry (Australia). Greens voters, other voters and non-voters removed.
% of respondents
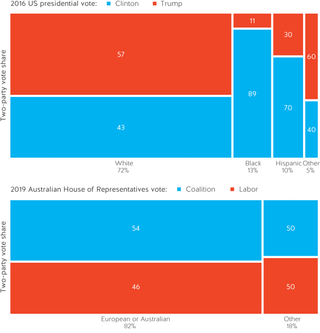
Measuring racial prejudice
Racial or ethnic pride — manifesting in ascribing negative stereotypes to others — is a near-universal human trait, observed in varying degrees across cultures, time and place. Australian writer Robert Hughes once observed that “racism is as Australian as lamingtons and sausage rolls”.37 Nonetheless, Australians frequently point to racism as one of the least desirable features of the United States.
In order to quantify the prevalence and political significance of racial prejudice, social and political researchers have traditionally used survey items that ask respondents to rate various racial and ethnic groups on scales ranging from “hard working” to “lazy”, “intelligent” to “unintelligent”, or “rude” to “polite” or “violent” to “peaceful”.38 Differences in the ratings given to the respondent’s own group relative to others measure the extent to which the respondent holds prejudicial beliefs, say, when a White American respondent rates White Americans as more “hardworking” than African-Americans or Latinos, or when an Australian of European ancestry rates Indigenous Australians as less intelligent than Whites.
Australians frequently point to racism as one of the least desirable features of the United States.
Two of the 7-point stereotype scales were utilised in the surveys fielded in both Australia and the United States: the “lazy” to “hardworking” scale and the “intelligent” to “unintelligent” scales. Australian respondents were asked to assign scores to four racial and ethnic groups: (1) Whites; (2) Indigenous Australians; (3) Chinese; (4) Indians. American respondents were asked about (1) Whites; (2) African-Americans; (3) Hispanics; (4) Asian-Americans.
We restricted this part of our analysis to the views of members of the largest racial or ethnic group in both countries. In the United States, we analysed the views of seventy per cent of respondents who reported being ”White”. In Australia, our analysis focused on the 81 per cent of respondents who identified as being of “European” or “Australian” ancestry.
Figure 35 shows the rates at which Australian respondents of European or Australian ancestry reported prejudiced beliefs about Indigenous Australians, Chinese and Indians. More than half of this group (54 per cent) reported Indigenous Australians as lazier than White Australians: 33 per cent reported no difference between Whites and Indigenous Australians on this dimension, and 13 per cent reported a more positive stereotype of Indigenous Australians than Whites on this dimension. A slightly smaller proportion of Australians of European or Australian ancestry, 47 per cent, viewed Whites as more intelligent than Indigenous Australians, while 44 per cent gave both Whites and Indigenous Australians the same score.
Figure 35. Australian prejudice toward Indigenous Australians greater than any US prejudices
Comparison of ratings of non-White groups with Whites (United States) or Australians with European or Australian ancestry
Rates of prejudice and neutrality by US and Australian respondents
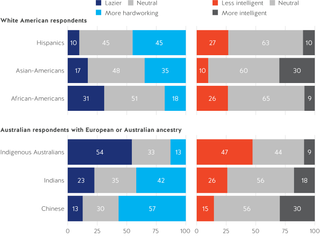
More than half of Australian respondents of European or Australian ancestry rated Chinese as harder working than Whites, and 42 per cent made this assessment of Indians relative to Whites. Only 13 per cent of this group of Australian respondents reported Whites as working harder than Chinese, while only 15 per cent said Whites are more intelligent than Chinese. Australian respondents of European or Australian ancestry were less likely to report differences between racial and ethnic groups with respect to intelligence, but still, 30 per cent reported Chinese being more intelligent than Whites.
Are White Australians more racist than White Americans?
Compared to Australian respondents of European or Australian ancestry, White Americans were generally less likely to report racially prejudicial comparisons of non-Whites.39 Across the two dimensions of evaluation (lazy to hardworking and intelligence) and the three non-White groups (Asian-Americans, Hispanic-Americans and African-Americans), the highest rate of White American prejudice was the 31 per cent who reported that African-Americans are lazier than Whites. Half of White Americans (51 per cent) reported no differences between Whites and African-Americans with respect to work ethic, and 65 per cent reported no differences between Whites and African-Americans with respect to intelligence. These rates of racial and ethnic equality are higher than what was observed among Australian respondents of European or Australian ancestry.
Tables 5 and 6 show the percentages of White American and Australians of European or Australian ancestry with different combinations of prejudiced evaluations of non-White groups. One in five White Americans reported that Whites are both harder-working and more intelligent than African-Americans, and 38 per cent of White Americans made at least one of these racially prejudicial comparisons. Forty-six per cent of White Americans provided at least one report of Whites being superior to the three non-White groups on one or both of the lazy to hard-working or intelligence scales.
Table 5. Percentage of White Americans reporting negative stereotypes of out-groups relative to Whites
|
|
White Americans views of non-White groups |
|
|
|
Both lazier and less intelligent |
Either lazier or less intelligent |
|
African-Americans |
20 |
38 |
|
Hispanics |
5 |
31 |
|
Asian-Americans |
5 |
22 |
|
All |
3 |
9 |
|
Any |
21 |
46 |
Table 6. Percentage of Australians of European or Australian ancestry reporting negative stereotypes of out-groups relative to Whites
|
|
White Australians views of non-White groups |
|
|
|
Both lazier and less intelligent |
Either lazier or less intelligent |
|
Indigenous Australians |
38 |
64 |
|
Indians |
11 |
37 |
|
Chinese |
5 |
22 |
|
All |
2 |
12 |
|
Any |
41 |
69 |
Thirty-eight per cent of Australians of European or Australian ancestry reported that Whites are both harder-working and more intelligent than Indigenous Australians, and almost two-thirds (64 per cent) reported at least one of the racially prejudicial comparisons. Sixty-nine per cent of Australians of European or Australian ancestry had at least one instance of reporting that Whites are superior to one of the non-White groups on either the lazy to hard-working or intelligence scales.
A slim majority of White Americans, 54 per cent, did not report Whites being superior to any of the three non-White groups on either of the two dimensions of evaluation. The corresponding figure in the Australian data is lower, just 31 per cent. Reflexive, universal racial prejudice is rare in both countries: just two per cent of Australians of European or Australian ancestry and three per cent of White Americans always asserted that Whites are superior to the three respective out-groups on both evaluative dimensions.
Comparisons across countries are delicate, given the different racial and ethnic groups presented to respondents in the two countries. Nonetheless, members of Australia’s dominant racial majority — Australians of European and Australian ancestry — seem more likely to report overtly prejudicial beliefs than White Americans.
Prejudice and political preferences
Within each country’s dominant racial or ethnic groups, political preferences were strongly associated with prejudice (Table 7). In the United States, prejudiced Whites overwhelmingly preferred Trump over Clinton in 2016, while Clinton was the preferred choice of Whites who did not report prejudiced beliefs. In two-party terms, Trump beat Clinton 72-28 among prejudiced White Americans, while Clinton led Trump 57-43 among non-prejudiced White Americans.
Table 7. Prejudice and political preferences in Australia and the United States
% of respondents
|
|
White survey respondents |
||
|
|
Prejudiced |
Non-prejudiced |
Difference |
|
White Americans (two-party vote) |
|||
|
Trump |
72 |
43 |
29 |
|
Clinton |
28 |
57 |
-29 |
|
Australians of European or Australian ancestry (two-party vote) |
|||
|
Coalition |
58 |
44 |
15 |
|
Labor |
42 |
56 |
-15 |
Prejudicial views were also strongly associated with political preferences in Australia. Among Australians of European or Australian descent, those with prejudiced views were 16 percentage points more likely to report supporting the Coalition in 2019 than their non-prejudiced co-ethnics.
In two-party terms, there was a 15 percentage point difference between prejudiced and non-prejudiced Australians of European or Australian ancestry, with Coalition-Labor two-party splits of 58-42 and 44-56, respectively.
These findings echo many other analyses of the American electorate,40 finding that racially prejudiced beliefs are among the strongest discriminators of vote choice among White Americans. It is close to impossible to find a single political attitude that cleaves Australian voters as powerfully as prejudice segregates White Americans.
Artificial intelligence
Artificial technology (AI) has rapidly advanced from the realm of fanciful science fiction to that of reality in recent decades. Innovations in wearable devices, voice-activated home assistants and algorithm-driven advertising have increasingly enmeshed artificial and human intelligence in the daily lives of billions of people around the world. AI has also displaced workers. Jobs that were once filled by people on production lines in factories are now taken by machines. This uneasy transition is already visible in some parts of the United States and Australia, where proud histories of manufacturing are clashing with economic futures that appear to be dominated by services.
With the future of work facing such uncertainties, it is important to gain a sense of how Australians and Americans of various ages and educational backgrounds view such a threat.
Central to President Trump’s campaign promise to “Make America Great Again” was the restoration of many of these lost manufacturing jobs. Australia has similarly seen campaigns and promises in recent years to protect jobs from automation in the automotive and mining sectors. However, the ability of any national government to protect these jobs is limited, with recent studies finding that almost half of the jobs in OECD countries are likely to be significantly affected by automation in the near future — though the risk varies across sectors.41
With the future of work facing such uncertainties, it is important to gain a sense of how Australians and Americans of various ages and educational backgrounds view such a threat.
Figure 36. Across age groups, Australians are more positive about artificial intelligence than Americans
Question: Thinking about you and your family, is artificial intelligence a positive development, a negative development, or neither a negative nor a positive development?
% of respondents
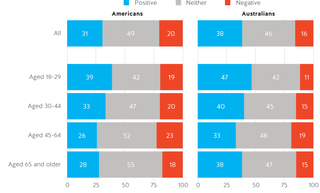
Evaluating artificial intelligence
While Australian and American respondents reported high levels of awareness of artificial intelligence, substantially fewer had formed a positive or negative evaluation of the effects of AI on them personally or their families (Figure 36). Almost half of American respondents (49 per cent) and 46 per cent of Australian respondents reported AI as “neither a positive nor negative development”. This neutral response was the most frequently given response across almost all age and educational categories in both the United States and Australia. To Australians and Americans, the impact of artificial intelligence appears to still be in the future, with slim majorities able to offer a positive or negative evaluation of it today.
There were differences between the two countries, though. Among those providing evaluations on AI, Australians were substantially more optimistic about AI, with positive evaluations leading negative evaluation by 22 points (38 to 16 per cent), compared to 11 points among Americans (31 to 20 per cent). In both countries, younger people were more positive about the growth of AI than older cohorts. Almost a majority of Australians aged 18-29 reported positive evaluations (47 per cent), while just 11 per cent reported negative evaluations.
Figure 37. Across levels of education, Australians are more positive about artificial intelligence than Americans
Question: Thinking about you and your family, is artificial intelligence a positive development, a negative development, or neither a negative nor a positive development?
% of respondents
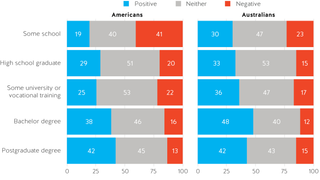
In both the United States and Australia, more positive evaluations of AI tended to accompany higher levels of education, while in the United States, in particular, those with less than a high school education were particularly negative about the possibilities of AI. Just 19 per cent of respondents in this latter group expressed a positive view, and 41 per cent a negative view. Conversely, while Australians who did not finish high school were the least positive about AI, they were still more likely to express a positive response (30 to 23 per cent), and they were substantially more positive than Americans with similarly low levels of education. Among those with postgraduate degrees, there were identical evaluations of AI in both Australia and the United States, with positive evaluations far outnumbering negative evaluations by 29 points in the United States (42 per cent to 13 per cent) and 27 points in Australia (42 per cent to 15 per cent).

AI and jobs
In both the United States and Australia, a majority of respondents reported that they believe AI is either extremely or very likely to make it harder to find employment. This is perhaps the most definitive set of views on AI of all the responses. Fifty-five per cent of Americans and 59 per cent of Australians said it was extremely or very likely that “people would have a hard time finding jobs” if “robots and computers were able to do much of the work currently done by humans” (Figure 38). Adoption of AI this widespread is also forecast to exacerbate inequality between rich and poor. A total of 46 per cent of Americans and 52 per cent of Australians said this outcome is extremely or very likely.
Though Australians were more likely to hold optimistic views of AI than Americans, both countries saw the prospect of AI creating new, better-paying jobs fairly equally. Just 17 per cent of Americans and 19 per cent of Australians saw new, better-paying jobs as extremely or very likely in a world in which AI is capable of performing much of present-day work.
Figure 38. The average American view similar to average Australian view on impact of AI on jobs and inequality
Question: If robots and computers were able to do much of the work currently done by humans, then how likely is it that ........
% of respondents who said a particular outcome is either extremely or very likely
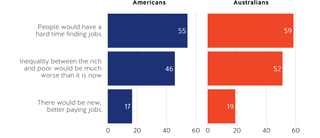
While believing that the widespread adoption of AI would make employment more difficult, relatively few Americans and Australians saw a definite, near-term threat to their current occupation (Figure 39). Just ten per cent of Americans and 13 per cent of Australians disagreed with the proposition “In ten years’ time, my current occupation will still exist.” Another third of Americans and Australians were unsure, but majorities in both countries (56 per cent in the United States, 57 per cent in Australia) reported that their occupation is secure for at least another ten years.
Younger cohorts reported more optimism on this score than older respondents in both countries, and a higher level of educational attainment was a strong predictor of optimism about the longevity of occupations. Eighty per cent of Americans and 65 per cent of Australians with postgraduate degrees agreed that their occupation will exist in ten years’ time. These rates fell dramatically across levels of educational attainment in the United States. Just 39 per cent of Americans with less than a high school education reported a similar level of optimism. Nineteen per cent of this group believed that their present occupation will not exist in ten years’ time — the same amount as Australians with less than a high school education. These levels of pessimism among the least educated are twice the base rate of pessimism in the general population — an indication of the expectation that the costs of automation and AI will fall disproportionately on those without the security of a high level of formal education.
Figure 39. Most Americans and Australians believe their job will exist a decade from now
Question: In ten years’ time, my current occupation will still exist
% of respondents
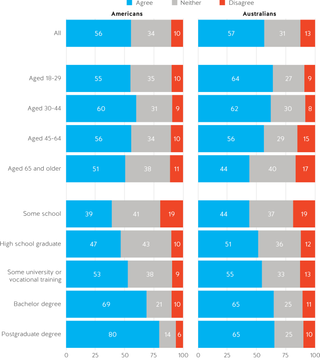
While American and Australian respondents saw risks to jobs and economic equality stemming from the widespread adoption of AI, how many thought that such a profound upheaval of work and occupations is imminent? Figure 40 shows that 32 per cent of Americans and 37 per cent of Australians said it is extremely or very likely that “in the next ten years, robots and computers will do much of the work currently done by humans.” Australians were slightly more likely than Americans to believe that AI will profoundly transform work in the next decade, by five points overall. Australians outpaced Americans in every age and educational slice of the two populations on this metric. In both countries, older respondents were slightly more likely than younger respondents to make this assessment.
Figure 40. About half of those agreeing that AI will replace much of the work done by humans also believe that their occupation will continue to exist over the next ten years
% of respondents
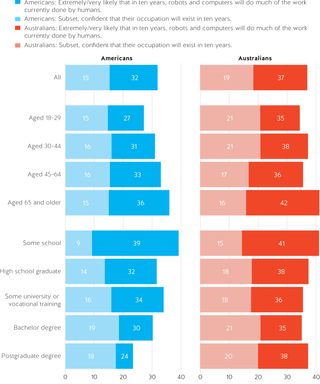
Australians were generally more personally confident about AI than Americans, while slightly less sanguine about the consequences of AI for employment and economic inequality. US respondents with lower levels of formal education were especially pessimistic about the advent of AI, more so than Australians with the same relatively low levels of educational attainment. Long-standing differences in the two countries’ labour markets — and wage bargaining and industrial relations systems — help rationalise these differences of opinion. Moreover, due to wage differentials and trade exposure, Australia’s manufacturing sector is smaller than that in the United States, a sector especially vulnerable to automation.
These results indicate that differences in the nature of work in the United States and Australia existing today powerfully shape difference in opinions about AI and its future impact on work between the two countries. This helps explain how Australian respondents could simultaneously be (a) more confident that AI is likely to transform the nature of work than Americans, (b) slightly more confident that their present occupation will survive and hence (c) generally more upbeat about the impact of AI on them and their families.
Towards 2020
The Trump administration filed its paperwork for re-election with the US Federal Election Commission just hours after President Trump’s inauguration on 20 January 2017.42 The Democrats, meanwhile, have had official candidates for the party’s presidential nomination in the field since July 2017.43 The 2020 presidential election has been well underway since.
With the stark partisanship found throughout this survey coupled with the highest turnout for midterm elections in more than a century in 2018,44 it seems that the United States is in the midst of a period of heightened political awareness and anxiety, set to converge on 3 November 2020, when the next presidential election is held.
Interested Australians will be watching these elections closely. It is clear from several experiments conducted in this survey that Australians have largely negative reactions to President Trump, and detailed below is their preference that the United States elect a new President in January 2021. For the Democrats, this may be difficult to deliver, as President Trump retains strong support from Republicans, and may again benefit from the electoral college.
A Trump win is a real possibility
As a measure of vote intention, American respondents were asked to state their preference in a series of head-to-head runoffs between leading Democratic candidates and President Trump. Each respondent was asked to decide on three possible contests, with the Democratic candidate randomly selected from a list of seven leading contenders (the most popular options as of July 2019).
The responses they gave were then compared with their stated 2016 presidential election vote and calculated to determine whether, as of late July 2019, they were: highly likely to vote Democratic in 2020 (selected the Democratic option all three times); persuadable (selected at least one of each); or, highly likely to vote Republican in 2020 (said they would vote Trump regardless of the identity of the Democratic candidate).
This highlighted another outcome of the intense political polarisation in the United States: there appear to be very few swing voters up for grabs in 2020.
While some Democrats polled more strongly than others, falls in support for Democratic candidates did not translate into gains in support for Donald Trump. Rather than expressing a preference for Trump, some respondents reported that they would not vote or would support a third party or independent if their preferred Democratic candidate was not on the ballot.
This indicates how little voter intentions have changed since 2016. Figure 41, shows that 97 per cent of voters who voted for Donald Trump in 2016 said they would vote for Trump, regardless of the Democratic candidate they were offered. Conversely, 94 per cent of respondents who voted for Hillary Clinton in 2016 said they would vote for the Democratic candidate every time they were asked. This highlighted another outcome of the intense political polarisation in the United States: there appear to be very few swing voters up for grabs in 2020.
This ultimately suggests it will be difficult for Democrats to wear down Donald Trump’s base of support between now and the election.
Figure 41. For 2020, Trump base and opposition remain largely unmoved since 2016
American respondents’ 2020 vote intentions, by 2016 vote
% of respondents
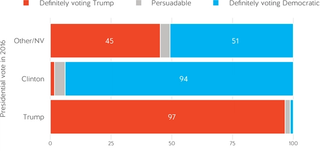
Remember the Electoral College
The American presidency is not decided by national vote tallies (the so-called “popular vote”). Rather, presidential elections are decided by a majority of the Electoral College, a system of indirect election where the winner of the presidential election in each state (except Maine and Nebraska) is given all of the Electoral College votes for that state, which are allocated across states in a way that is roughly proportional to population.
Like George W. Bush in 2000, Donald Trump won the presidency in 2016 despite winning fewer votes nationwide than the Democratic candidate.
Indeed, Trump won the presidency despite trailing Clinton by 2.1 per cent nationally, 45.9 per cent to 48 per cent, winning the Electoral College with narrow wins in “Obama” states, including Michigan, Wisconsin and Pennsylvania. Clinton, on the other hand, won lopsided victories in large, blue states, including California, New York and Illinois; but these states were never expected to be competitive for Trump.
Given the observed stability of vote intention, the geographic distribution of 2020 support for Trump could closely track its 2016 distribution, leaving the distinct possibility of Trump again winning the presidency despite not being the plurality vote winner.
All of this is only exacerbated by the febrile atmosphere in Washington, and the chances that the outcome may be heavily influenced by impeachment hearings and an increasingly partisan media landscape.
Australians strongly prefer a Democratic president
Australians were not so evenly divided on the presidential contest, with an overwhelming preference that a Democrat win in 2020, regardless of which Democratic candidate.
Figure 42 shows Australian preferences for the 2020 US presidential election. They were asked whether they preferred Donald Trump, any Democratic candidate or another candidate altogether. By a ratio of 2:1 Australian respondents preferred an unnamed Democrat defeat Donald Trump in November 2020.
Only 20 per cent of Australians said that they wanted to see a second term of the Trump administration. This number is low even among Coalition voters, with less than one-third saying his re-election is their preferred outcome. This suggests that most Australians who had an opinion on the matter had a strong aversion to the re-election of President Trump.
This may not be just about Donald Trump, however. The results outlined throughout this report — which show Trump voters in the United States are generally much more conservative than most Australians (including most Coalition supporters) — provide another explanation.
Figure 42. Only a fifth of Australians want Trump to win in 2020
Question: Who would you like to win the 2020 election?
% of Australian respondents who wanted ........ to win the 2020 presidential election

Appendix: About the surveys
The surveys were fielded between 23-29 July 2019 in both the United States and Australia, by YouGov, a global public opinion and data company, to samples drawn from YouGov panels of respondents who have previously agreed to take surveys online. The US sample size is 1,800 and the Australian sample size is 1,820.
The US sample was formed by first segmenting the YouGov US panel on gender, age, race, and education, matching the distributions of those variables in the adult, citizen population of the US provided by 2016 American Community Survey 1-year sample. Randomly selected panellists in each segment were invited to take the survey. After data collection the responses were weighted to match the distributions of age, gender, race, education and vote choice at the 2016 presidential election (based on official vote tabulations). These two steps ensure the sample is representative of the adult, citizen population of the United States.
The Australian sample was formed by first segmenting the YouGov Australian panel on gender, age and region (urban/rural distinction within each state), matching the distributions of those variables in the adult, citizen Australian population provided by the 2016 Census. Randomly selected panellists in each segment were invited to take the survey. After data collection, the responses were weighted to match the distributions of age, gender and region (as provided by the 2016 Census, again subset to adult citizens). These two steps ensure the sample is representative of the adult, citizen population of Australia.
The maximum margin of error for each data set is approximately ±2.3 (Australia) and ±2.8 (United States) percentage points. For differences in results between the two countries, the maximum margin of error is ± 3.7 percentage points.
About factor analysis determining the political spectrum
As we cannot measure political ideology directly — it is a latent “unknown” variable comprised of multiple dimensions, including various political, social, and economic factors — we subset our survey data for seven questions which are influential for shaping political ideology.
We define the political ideology of survey respondents by ranking and compressing positions on several issues to a median point on the defined ranking scale. The issues include four questions on government spending, two additional items on the role of hard work in success, and a question on whether taxes should be increased. Broadly speaking, these items fit under an umbrella of questions on social inequality and government intervention.
In these questions, respondents were asked to select an answer out of a rating — for example, a response from “strongly agree” to “strongly disagree” — which can be transformed into a numeric variable where, for example, “strongly agree” maps to 4 and “strongly disagree” maps to 1. The newly created numeric variables can be summed together in what is called a linear combination — that is, each variable is multiplied by a constant then added together. This method is known as factor analysis; it reduces the selected seven items down to one score. Without considering the unknown constant, a respondent who selected “strongly agree” for all seven items would receive a score of 28 out of a potential 28 on the ranking scale.
This new scale is further reduced to summary statistics. The weighted median for this measurement is taken among various groups — be that the candidate or political party whom the respondents voted for in the last election or consumers of certain media outlets. As this median value is only an estimate of political ideology, we additionally calculate where the middle 50 per cent and 80 per cent of survey respondents fit on the scale to give a better idea of where the particular group of respondents might potentially lie on the scale.
Note that the ideology estimates were calculated separately for Australian and American respondents. In other words, the median value for Australians is not distorted by different political ideologies in the United States and vice-versa.
