Executive summary
The exact future of the global economy is uncertain, but its direction is clear: services will become more valuable, the creation of value will be tied to knowledge-intensive and automated processes and skills, and firms and individuals will need flexibility and resilience.
In short, success in the future global economy will require countries and companies to be more innovative. The march toward this scenario has been accelerated by the global pandemic. Yet while the global economy is quickly shifting, Australia, for the most part, is not.
Australia’s woes in innovation are well-documented: In global rankings of economic complexity — a measure generally correlated with future economic growth — Australia has fallen behind countries like Uzbekistan and Botswana. Australia’s research and development (R&D) spending as a percentage of global domestic product (GDP) decreased every year of the past decade. Australia’s innovation ranking has fallen steadily out of the top 20 in the world.
Australia’s approach to addressing these challenges has overly focused on internal developments, while too often ignoring the innovation occurring overseas and — most critically — how to bring more of it to Australia.
Australia’s woes in innovation are well-documented: In global rankings of economic complexity — a measure generally correlated with future economic growth — Australia’s has fallen behind countries like Uzbekistan and Botswana.
This report argues since the Second World War no single country has continually helped Australia to be more innovative than the United States. In addition to the fact Australia now receives more investment from the United States than any other country, US investment is larger than any other foreign country’s investments in 14 out of 19 sectors of Australia’s economy.1
Beyond investment, the United States is also Australia’s largest services trading partner with two-way trade which is dominated by future-orientated industries particularly intellectual property, research and development, and telecommunication and computer services.
The importance of US engagement is not a mere issue of size: the contribution to Australia’s GDP per employee of a US firm is more than three times greater than that of an employee at an Australian-owned firm and 22 per cent greater than that of an employee at a foreign firm which is not US-owned.
US policymakers deemed it to be in the US national interest for the nation’s closest allies, who share similar values, political systems and cultures, to be both economically interlinked with the United States and more innovative. But it is largely up to Australia to enact the appropriate policy settings to fully realise the potential of such ties.
This report details:
- Where the global economy is shifting and the ways in which Australia has not shifted accordingly
- How US economic engagement has made Australia more innovative and continues to do so today
- The steps three US allies and partners — Israel, South Korea, and Germany — have taken to become more innovative
- Four case studies of what it looks like when US firms innovate in Australia
- Ten policy recommendations, setting a pathway for the Australian Government to foster innovation both independently and in tandem with the US Government.

Where the global economy is shifting
Trade is not what it used to be. Multilateral institutions are less effective, international borders are harder, economic nationalism is on the rise and goodwill and trust in trade are on the decline. While some of this may be due to headwinds from geopolitical developments, this also reflects a broader shift in the global economy.
A landmark McKinsey Global Institute report in January 2019 determined five key shifts in the global economy:2
- Trade in services already constitutes more value in global trade than goods
- All global value chains are becoming more knowledge-intensive
- In an era of automation, low-skill labour is becoming less important as a factor of production
- Flexibility and resilience are critical in a time of increasingly complex unknowns
- Advanced economies, due to their strengths in innovation and services, as well as highly skilled workforces, may benefit the most from such trends
More than a year later, the McKinsey report — a distinct departure from the longstanding and conventional understanding of the global economy — seems prescient. One needs to only look at the recent developments with the smartphone to see an acute realisation of these trends.
Fewer goods trade: Consumers are buying far fewer separate utilities such as calculators, encyclopedias, dictionaries, music players and cameras than in the year 2000 for the simple reason all these items (and countless more) are contained in their pocket, on a smartphone. Instead, consumer purchases are increasingly geared toward services — media subscriptions, business services, and more. Even before the pandemic-induced downturn occurred, trade, in general, was down from prior highs, with world trade in goods in 2019 expanding at its lowest rate in a decade.3
Prioritised knowledge intensity: The knowledge-intensive work necessary to develop and update smartphone hardware has dramatically increased. This is evident in everything from global expenditures on R&D — which tripled from the year 2000 to more than US$2 trillion in 20184 — to the number of software engineers around the world — which increased from an estimated 18.2 million in 2013 to 23.9 million in 2019 and is expected to overtake the population of Australia within the next few years.5
The number of software engineers around the world has increased from an estimated 18.2 million in 2013 to 23.9 million in 2019 and is expected to overtake the population of Australia within the next few years.
Deprioritised unskilled labour: The designers and engineers of smartphones require intricate and advanced skillsets which cannot be easily outsourced to cheaper destinations in the developing world. The majority of the design process of the iPhone, for instance, has never been conducted outside of the developed world. Its final assembly may be in China and software support may be in India but the comparative advantage of Apple will increasingly be less in labour production arbitrage and more in software development conducted in the United States and other developed countries.6 The arms race for software engineering talent will become fiercer than the pursuit of cheaper manufacturing processes.
Increased flexibility and resilience: The fact that Apple is considering shifting production of the iPhone from China — where every iteration of the iPhone has been made since the first version came out in 2007 — is indicative of just how much flexibility and resilience has become integral to global trade practices. The active consideration of production of iPhones outside of China was brought about by the US-China tariff battle which began in 2018 but such tensions will not abate should President Trump lose the November 2020 election. As much as polarisation has plagued US politics, an appetite for strategic competition with Beijing — including an economic decoupling from China — is one of the few remaining areas of bipartisanship in Washington. Strategic competition between the United States and China is unlikely to decrease in intensity anytime soon.
Reinforced advantage of advanced economies: Of all numerous nations and companies involved in the making of an iPhone, it is ultimately the US-based Apple which gets the most value from its sales.7 The most innovative and service-oriented economies will likely continue to have the most economic resilience. Such economies, like Japan, Switzerland, and the United States top the global rankings of economic complexity and innovation.8 Ultimately, such countries already have the advantage of being further along in the development of future innovative and service-oriented industries.
Case study: Amgen
Key figure: For more than 30 years, Australia has been one of the most trusted destinations in the world for Amgen research
Innovative impact: Amgen’s clinical studies connect Australian clinical researchers into global programs at the forefront of medical developments and expedite the clinical availability of innovative drugs in Australia
NASDAQ: AMGN
Headquarters: Thousand Oaks, California
One of the largest independent biotechnology firms in the world, southern California-based Amgen discovers, develops, manufactures and delivers innovative human therapeutics.
Founded in 1980, Amgen is a pioneer in the science of using living cells to make biologic medicines and helped invent the processes and tools that built the global biotech industry. With a presence in approximately 100 countries worldwide, Amgen focuses on six therapeutic areas: cardiovascular disease, oncology, bone health, neuroscience, nephrology and inflammation.
Understanding the biological mechanisms of disease is a defining feature of Amgen’s discovery research efforts. One aspect of this strategy is to leverage human genetics to show that human genetic validation of drug targets, applied as a forward-looking strategy, can help cut the high failure rate that has plagued drug development programs for decades. Amgen posits that human genetics offers a key approach to addressing both the complexity of biology and the industry’s R&D productivity challenges.
Since establishing its Australian presence in 1991, hundreds of thousands of Australians have used one of Amgen’s products, and thousands more have been enrolled in clinical studies that have helped deliver the next generation of innovative treatments.
Amgen’s history of clinical trial activity in Australia dates back 30 years. In 2019, this included 473 Australian patients, participating in 48 clinical trials and more than 20 investigator-sponsored studies, at more than 60 leading Australian hospitals. These studies are essential to Amgen’s global R&D and connect Australian clinical researchers into globally coordinated programs that both expedite the clinical availability of innovative drugs in Australia and allows Australian clinicians to stay at the forefront of global medical developments.
Amgen has a strong commitment to inspiring the next generation through the Amgen Foundation programs. The foundation’s work includes the Amgen Biotech Experience, which was launched in Australia in 2017 through a partnership with the University of Sydney and provides professional development for teachers as well as teaching materials and research-grade equipment to classrooms to help educate students about the concepts and techniques scientists use to discover new medicines. In 2018, the foundation also launched the Amgen Scholars program with the University of Melbourne to provide hands-on research experience in leading laboratories to undergraduate science students.

Where the Australian economy has not shifted
The year 2007 marked a dramatic shift in Australia. It was the high watermark of globalisation before the financial crisis; it was also the year China supplanted the United States to become Australia’s largest trading partner — remaining so ever since.
Since 2007, Australia’s two-way trade with China has more than quadrupled to amount to A$235 billion in 2018-2019. This is an amount larger than the two-way trade Australia has with Japan, the United States, and South Korea combined — Australia’s second, third, and fourth-largest trading partners respectively. Australian two-way trade with China in 2019 was more than three times the amount of trade with the United States (A$76.4 billion).
Australia’s A$153 billion of exports to China in 2018-2019 was dominated by the extraction of natural resources — namely iron ore, coal and gold. Today, around 90 per cent of Australian merchandise exports to China are “primary” goods — simple items with little to no manufacturing or intellectual property, such as ores, gas, and unprocessed animal products. This means Australian natural resources are extracted, minimally processed (if at all), and sent to China — leaving few opportunities for Australian innovation to occur, beyond efficiency measures. And while services — comprised almost exclusively of tourism and education — are a growing component of Australian exports to China, they were a mere nine per cent of Australia’s total exports to China in 2018-2019.9
Figure 1. Australia’s two-way trade partners, 1998 and 2018
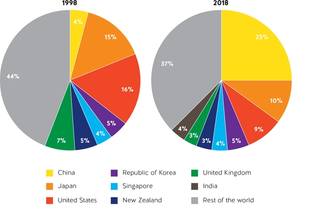
Chinese investment in Australia has dominated media attention in recent years though the leading sectors of Chinese investment, mining and construction, are ultimately not future-oriented sectors. Even then, Chinese investments in those sectors are still smaller than US investments and are expected to further decrease.10 In the 2018-2019 financial year, for example, US investment in Australian real estate tripled from the year before, totalling A$19.6 billion while Chinese investment in real estate in the same period decreased by half from the year before and totalled A$6.1 billion.11
Ultimately, Australia’s economic engagement with its largest trading partner is large but not very complex in that it preeminently consists of the simplest types of transactions, albeit sizeable ones that have helped Australia’s economy successfully navigate the global financial crisis.
Yet the recession-free economy Australia enjoyed for nearly three decades hid a less than rosy economic picture: even before the recent economic downturn, economic trends in Australia were not headed in the same direction as the future global economy.
The recession-free economy Australia enjoyed for nearly three decades hid a less than rosy economic picture: even before the recession, economic trends in Australia were not headed in the same direction as the future global economy.
In 2019, Australian goods exports remained dominated by raw and unprocessed natural resources without a single processed good making the country’s top five exports.12 Knowledge-intensive work was not prioritised, with business spending on R&D in 2017-2018 remaining more than half a billion dollars below 2010-2011 levels.13 Australian-based science and technology firms regularly bemoaned the fact Australia loses highly-skilled labour to regional neighbours thanks to lacklustre immigration regulations.14 Before the pandemic, warning lights regarding a lack of resilience were already blinking: Australia was found to be the single-most economically reliant country on China out of the Five Eyes nations.15 And Australia appeared to lack many of the advantages of other advanced economies. For example, Australia ranks behind Uzbekistan, Uganda and Tanzania in global economic complexity ratings.16 In the Global Innovation Index, Australia’s ranking has fallen from 17th in 2015 to 22nd in the world in 2019.17 Indeed, whether it is Australia’s business expenditure on research and development (BERD), the level of Australia’s high-tech exports, or its business-research collaboration — Australia ranks near the bottom of Organisation for Economic Co-operation and Development (OECD) countries, if not last.18
Australia has so far managed the public health aspect of the pandemic more effectively than much of the developed world. Yet the global shifts occurring before the pandemic — particularly the digital transformation of everything from shopping to media consumption, the need for flexibility and resilience, and strategic competition between the United States and China — have clearly since been accelerated by it.
Case study: Cook Medical
Key figure: Exports 94 per cent of its Australian-manufactured products to 64 countries around the world
Innovative impact: Pioneered, developed and commercialised, innovative medical solutions that are now exported around the world — all while keeping the research and manufacturing lines in Australia
Privately held
Headquarters: Bloomington, Indiana
Headquartered in Bloomington, Indiana, Cook Medical is a family-owned company, founded in 1963. After having started with wire guides, needles and catheters, Cook Medical now has more than 10,000 employees around the world and manufactures products across 60 medical specialties that can be found in 135 countries.
The company began operations in Australia in 1979. Forty-one years later, the Cook Medical Australia team manufactures and conducts R&D across two product families: stent-grafts for the treatment of vascular disease and in-vitro fertilisation to assist those trying to conceive a child. Both of these Cook Medical product lines were invented and developed in Australia, with the former developed in partnership with Perth-based vascular clinicians and the latter with pioneering IVF units in Melbourne and Sydney.
Since the early 2000s, the Cook Medical Australia team has tripled in size and today employs some 650 people, 40 of whom are directly involved in engineering and R&D. From its purpose-built R&D and manufacturing facility in Brisbane, Cook Medical Australia exports more than 94 per cent of its locally manufactured products to 64 countries around the world. That facility is also home to engineers who continue work on the two product families as well as blue-sky R&D, supported by Cook Medical’s ongoing commitment to Australian innovation.
More than four decades of an Australian presence has allowed Cook Medical to develop extensive ties across the country. This includes collaborations with a number of Australian universities like the Brisbane-based University of Queensland, a key partner for Cook Medical, as well as other research and industry entities like the Australian Research Council's Research Hub for the Advanced Manufacturing of Medical Devices as well as a number of Australian small and medium-sized enterprises (SMEs).
Innovation and the history of US economic engagement with Australia
While the United States and Australia have engaged economically since 1792, when the Philadelphia sailed into Sydney Harbour, the history of American companies making Australia more innovative begins in the most acute sense during the Second World War. This was when Australian troops in the Pacific were commanded by US General Douglas MacArthur and when the Australian economy became central to supplying the allied war effort in the region.
No single program was more integral to these economic linkages than the Lend-Lease Act signed into law in March 1941. Instead of merely selling US supplies to US allies in the war effort, the program allowed the US Government to lend or lease supplies to “the government of any country whose defense the President deems vital to the defense of the United States.”19
In essence, the Lend-Lease Act allowed the United States to supply key allies, like the United Kingdom and Australia, with critical US material and equipment needed for the war effort. As David Uren notes in The Takeover, the impact of Australia’s increased economic linkages to the United States in this period had lasting results:
“…the Australian economy was swept into the task of supplying the US war machine in the Pacific. The US Lend-Lease program delivered the latest US plant and equipment to upgrade Australia’s manufacturing capability for delivering everything from bomber aircraft to radios, steel, ships, clothing and tinned chilli con carne. Production of canned vegetables went from 4,000 tons at the beginning of the war to 60,000 tons by the end … At the end of the war, a deal was cut under which Australia would pay the United States $27 million (about 9 million pounds) for the Lend-Lease equipment it was leaving behind. The war left Australia with a much larger and more sophisticated manufacturing base than it had five years before, and it also deepened links between Australia and the United States.”20

By the 1950s, US foreign investment around the world had grown, nearly tripling from US$11.7 billion to US$31.9 billion by the end of the decade, but it would be faster in Australia than almost anywhere else. The rapid increase in post-war foreign investment did not only benefit the capital-thirsty Australian economy. According to a 1964 study of US investment in Australian industry by Don Brash, the future governor of the Reserve Bank of New Zealand, the foreign investment “provided access to much of the technical knowledge and managerial skill developed in the more industrially advanced countries of Europe and North America.”21 In 1958, the Australian Treasury Department determined that foreign direct investment, much of it being American, “helped us invaluably during recent years…by the addition it has to investible funds within Australia and by the accompanying flow of new techniques and know-how.”22 The combination of foreign capital and foreign skills transfers was “a vital force impelling growth throughout the [Australian] economy,” Brash said.
Australian critics of US investment at the time — most of whom targeted General Motors-Holden, a joint US-Australian entity — made clear what they found most objectionable about US investment in Australia: increased productivity. As Labor politician Clyde Cameron said in Australia’s parliament in November 1953 regarding a US-Australia tax treaty: “Russian workers might put up with it, but free workers will not stand for a boss supervising their every movement, timing it with a stop-watch, and calculating to the exact second the time that a man takes to unscrew a nut from a bolt, or to walk from one part of a factory to another.”23
While US investment into Australia would continue to remain prominent in Australia for the decades after World War II, it was only after foreign investment regulations in Australia were relaxed in the 1980s that US investment into Australia began to look as it does today.
The debate on a tax treaty with the United States was clearly about more than a simple tax treaty. Indeed, much like today, Australia’s economic ties with the United States in this period had implications far beyond Australia’s economic growth. Future Labor Party leader Arthur Calwell said as much in the same 1953 parliamentary session: “Only 300 miles from our shores there is an Indonesian Republic with a Premier whose cabinet is largely Communist, and if we fail to develop this country while we have the opportunity to do so, our plight will be even worse than it was when World War II broke out.” It was, he said, “in this spirit” that he supported the tax treaty bill with the United States.24
While US investment into Australia would remain prominent in Australia for the decades after World War II, it was only after foreign investment regulations in Australia were relaxed in the 1980s that US investment into Australia began to look as it does today. From that period to today, US foreign investment into Australia has consistently comprised 25 per cent or more of all foreign investment into Australia — a far larger proportion than any other country.
Yet at the same time, as much as the quantitative value of US investment into Australia remained steady, the qualitative and more intangible gains from such a relationship remained top of mind for the key shepherds of the US-Australia economic relationship. This was abundantly evident in the rationale for the Australia-US Free Trade Agreement (AUSFTA) which came into effect in 2005.
Robert Zoellick, one of the United States’ most accomplished foreign policy practitioners, was US Trade Representative in the early 2000s when he led negotiations on AUSFTA. Zoellick’s comments celebrating the success of the agreement make clear his rationale for the FTA went beyond trade barriers: “We hoped that the FTA would assist Australian business to integrate with US counterparts so Australians would gain from global innovation.” From Zoellick’s view, those involved in establishing the free trade agreement sought “to encourage Australian companies to connect with the US-led network for technologies, data mining, specialised customer service, product development, and marketing” because “Australia’s best would benchmark against the top global competitors.”25
Ultimately, it was deemed to be in the US national interest for the nation’s closest allies, who shared similar values, political systems and cultures, to be both economically interlinked and innovative.
Case study: Google
Key figure: Nearly $1 billion invested in Australian operations every year
Innovative impact: Google’s parent company, Alphabet, is the second-highest R&D spender in the world, spending US$16.2 billion across the world and A$300 million in Australia on R&D in 2018
NASDAQ: GOOGL
Headquarters: Mountain View, California
The company that has become synonymous with cutting-edge innovation in everything from wearable technology to navigation and of course email and internet search, Google has grown dramatically since it opened offices in Australia in late 2002.
Google now employs some 1,700 workers around Australia — approximately half of whom are engineers. It could not be more ubiquitous, with the Australian Government estimating that some 76 per cent of the Australian population use Google services.26 Yet despite such maturity, Google continues to invest hundreds of millions of dollars into its Australian operations every year.
Google’s multifaceted impact on Australia is substantial: One analysis determined that in 2019, Google enabled some 117,000 jobs in the broader Australian economy – with two-thirds of the jobs being in small and medium-sized enterprises — and generated some A$35 billion in diverse business products ranging from search and advertising to maps and video hosting.27 In the same year, content creators in Australia earned A$95 million through the Google-owned video-sharing platform YouTube while Australian businesses saved an estimated A$2.9 billion worth of time and money through the journey routing of Google Maps and improved access to information through Google Search.
In addition to the direct economic benefits of hosting a major multinational firm, the innovation capacity that a major anchor firm like Google unlocks for Australia is significant. The best-known example is Google Maps. Currently used by more than a billion people around the world, it was originally an Australian invention that was commercialised and taken global by Google.
But beyond commercialising Australian research efforts, Google has also served as a career launching pad for highly-skilled Australians. With Google Australia involved in managing global Google products as diverse as Photos, Chrome, Maps, and communication products, Google Australia’s engineers have gone on to work in some of Australia’s most promising digital companies.
Google has also been a platform for Australians to learn innovative skills abroad, with some 500 Australians now working for Google in other locations around the world. Ultimately, many of these innovative thinkers will bring their world-leading technology skills back home and make Australia’s economy more competitive.

Current US economic engagement with Australia
Australia’s A$1.8 trillion investment relationship with the United States is significantly larger than its relationship with any other country.28 This relationship means Australia receives more foreign investment from US firms than anywhere else and has so for decades. At the same time, Australian firms invest more in the United States than anywhere else in the world and, again, have done so for decades.
Looking cumulatively, the total US investment footprint in Australia — combining all forms of investment, including direct investment as well as portfolio investment — is valued at A$984 billion and is more than 40 per cent larger than the second-largest total investment footprint in Australia belonging to the United Kingdom at A$686 billion. The US direct investment footprint in Australia, cumulatively valued at A$205 billion, is more than 60 per cent larger than the second-largest direct investment footprint in Australia belonging to the United Kingdom at A$127 billion.
Cumulatively, US firms in Australia employ more, sell more, own more, spend more, export more and contribute more to Australia’s GDP than firms from any other country. In 2014, US firms spent A$14 billion on capital expenditures in Australia — more than 2.5 times more than the second-largest foreign spender on capital expenditures, the United Kingdom.29 And in the same timeframe, US firms added A$71.6 billion to Australia’s GDP — more than 2.4 times more than the second-largest foreign spender on capital expenditures, the United Kingdom.30
But the US impact in Australia goes beyond the cumulative because the 2,039 US firms and 272,700 employees of those firms working in Australia punch well above their weight.31 On a per-employee basis, US firms pay their employees more, spend more on business investment and contribute more to Australia’s GDP than the average Australian firm as well as the average foreign-owned firm that is not American.
Table 1. The oversized impact of US investment in Australia, per company and employee, 2014-2015
|
|
Operating businesses in Australia |
Average number of employees in a firm |
Average employee annual salary |
Capital expenditure per firm |
Capital expenditure per employee |
Industry value added per firm |
Industry value added per employee |
|
US-owned firms in Australia |
2,039 |
134 |
$71,300 |
$6,830,000 |
$51 |
$35.12 |
$262,610 |
|
Non US-owned firms in Australia |
7,907 |
88 |
$69,000 |
$3,700,000 |
$42 |
$19.00 |
$216,700 |
|
Australia-owned firms |
2,047,538 |
5 |
$49,400 |
$150,000 |
$30 |
$0.41 |
$84,000 |
The average employee of a US firm in Australia contributes three times as much to Australia’s GDP as the average employee of an Australian-owned firm and 22 per cent more than the average employee of a foreign-owned firm in Australia that is not US-owned. In terms of business investment per employee, capital expenditures by US firms — the money spent by a company to purchase or upgrade their physical assets like machinery, buildings and technology — is 69 per cent higher than Australian firms and 21 per cent higher than foreign-owned firms in Australia that are not US-owned. In terms of wages, the average employee of a US firm in Australia is paid A$22,000 more per year than the average employee of an Australian-owned firm and about A$2,000 more a year than the average employee of foreign firms in Australia that are not US-owned.
Analysing the US investment footprint in Australia from a firm-level also makes clear that the average US firm has more employees, spends more on business investment and has a greater economic impact than both Australian firms and foreign firms in Australia that are not US-owned.
US investment in Australia is more than just cumulatively larger. It is larger on a per employee and per firm basis too.
Table 2. The economic activity of foreign investors in Australia, 2014-2015
|
|
Operating businesses |
Employees |
Sales of goods and services ($m) |
Total assets ($m) |
Capital expenditure ($m) |
Industry value added ($m) |
|
United States |
2,039 |
272,700 |
210,359 |
593,362 |
13,920 |
71,614 |
|
United Kingdom |
842 |
141,400 |
96,988 |
166,527 |
5,288 |
29,538 |
|
Japan |
538 |
73,900 |
82,615 |
219,002 |
3,505 |
21,961 |
|
New Zealand |
420 |
38,400 |
26,024 |
25,120 |
402 |
4,866 |
|
Germany |
341 |
43,500 |
49,696 |
118,799 |
608 |
9,731 |
|
Singapore |
287 |
26,400 |
12,253 |
28,155 |
338 |
5,666 |
|
Canada |
263 |
27,500 |
20,451 |
38,991 |
2,213 |
7,246 |
|
France |
257 |
36,700 |
25,103 |
82,623 |
620 |
8,234 |
|
Hong Kong |
220 |
16,000 |
31,664 |
38,521 |
433 |
6,387 |
|
China |
204 |
13,100 |
15,830 |
137,481 |
1,296 |
4,753 |
Research and development
Few terms are more synonymous with innovation than research and development (R&D). With that said, increasing studies have proven innovation need not be solely derived from R&D — including in Australia.32 However, few would dispute that, for example, Israel — which leads the world in R&D spending as a percentage of GDP — is one of the most innovative countries in the world.33 And similarly, few would dispute Australia’s economy — which has seen total R&D expenditures as a percentage of GDP decrease every year since 2008 and now ranks 18th in the OECD — is not as innovative as it should be.34
Figure 2. Australian R&D spending as a percentage of GDP, 2008-2018
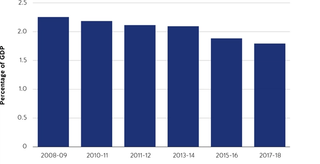
Research and development is generally conducted or funded by four types of entities: governments, businesses, non-profit organisations, and higher education. In Australia, no type of R&D has been more of a challenge in recent years than business expenditures on R&D (BERD). While R&D budgets in many leading global businesses increased in recent years, Australian BERD plateaued, if not decreased.35 According to the most recent data available, Australian BERD in 2017-2018 was well below levels of BERD in 2010-2011.36
Figure 3. Australian gross expenditures on R&D, 2008-2018
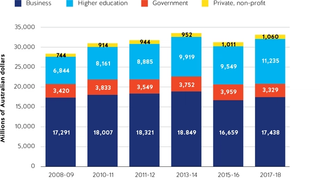
Figure 4. Australian business expenditures on R&D (BERD), 1992-2018
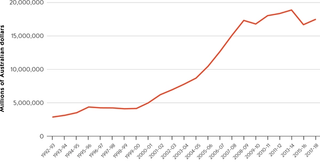
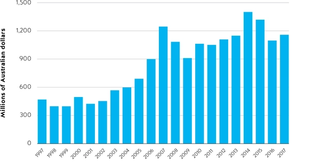
US firms conducting R&D in Australia have helped mitigate this challenge. Since 2010, US-owned firms have spent more than A$1 billion every year on R&D in Australia.37 In 2013-2014 (the most recently available data on R&D spending by foreign firms in Australia), firms that were fully foreign-owned were responsible for 27 per cent of all business R&D in Australia.38 Of this amount, more than a quarter (27 per cent) of the R&D spending in that period could be attributed solely to US firms.39
Figure 5. US-owned firms R&D spend in Australia, 1997-2017
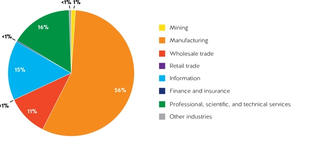
The sectoral breakdown of where US R&D in Australia occurs reflects the fact that US firms are conducting R&D in the most innovative sectors of the economy, with the largest spending occurring in manufacturing (56 per cent); professional, scientific and technical services (16 per cent); and information (15 per cent). Within the manufacturing sector, it can be presumed Boeing’s A$47 million spent on R&D in 2017 plays a significant role.40 The Australian branch of Boeing Research & Technology, the advanced R&D unit which arrived in Australia in 2008, can be credited with innovations like the “gaze tracker” technology, which allows a flight instructor to see where a student is looking in real-time.41
Figure 6. US R&D spending in Australia in 2017, by sector
Key sectors where US firms are most active in Australia
The depth and breadth of the US-Australian investment relationship becomes more tangible if analysed sector by sector. The Australian Government classifies businesses according to 19 various groupings, ranging from mining and manufacturing to construction and retail trade. The footprint of US businesses is the largest — measured by either owned assets or employee headcount — in 14 of the 19 economic sectors.42
Table 3. US investment largest in 14 of 19 sectors of Australia’s economy, 2014-2015
|
Economic sectors where US firms have the largest investment footprint in Australia |
Economic sectors where non-US firms have the largest investment footprint in Australia |
|
Accommodation and food services |
Agriculture, forestry and fishing |
More remarkable is the nature of the US footprint in these 14 groupings. The largest US investment footprint in Australia occurs in the sectors most critical for Australia’s future economic growth.
The industrial sector classifications can be relatively imprecise measurements of an economy — technology giants like Apple and Google, for example, are in different industrial classifications despite their selling many similar products.43 Yet with that said, arguably the most critical industrial classifications for Australia’s economic future would be manufacturing; information media and telecommunications; and professional, scientific and technical services. In all three of these sectors, US firms are not only the largest foreign investors, but no other country has even half the size of the US investment footprint.
The information media and telecommunications classification includes companies like Google and IBM.
Table 4. Foreign investment in Australia’s information media and telecommunications sector, 2014-2015
|
|
Operating businesses |
Employees |
Sales of goods and services ($m) |
Total assets ($m) |
Capital expenditure ($m) |
Industry value added ($m) |
|
United States |
113 |
13,000 |
5,610 |
29,419 |
617 |
2,357 |
|
United Kingdom |
32 |
900 |
575 |
972 |
21 |
137 |
|
France/p> |
11 |
300 |
49 |
56 |
2 |
10 |
|
New Zealand |
10 |
NA |
287 |
NA |
NA |
NA |
Thirteen per cent of assets in information media and telecommunications in Australia are owned by 113 US firms in Australia — representing 82 per cent of all foreign-owned assets in the classification. And while the classification includes journalists, the most common employee type in this group in Australia is a telecommunications worker44 — one of the most in-demand jobs in the future economy, with Australian jobs in this sector growing 13.5 per cent from 2013-2018. US-owned firms account for 13,000 Australian jobs in this industry classification or 10 per cent of all workers in the entire industry across Australia. US firms account for six per cent of the entire industry’s contribution to Australia’s GDP.45
The professional, scientific and technical services classification includes companies like Amgen and Cook Medical Group.
Table 5. Foreign investment in Australia’s professional, scientific and technical services sector, 2014-2015
|
|
Operating businesses |
Employees |
Sales of goods and services ($m) |
Total assets ($m) |
Capital expenditure ($m) |
Industry value added ($m) |
|
United States |
435 |
55,800 |
23,996 |
28,358 |
639 |
10,702 |
|
United Kingdom |
184 |
6,700 |
2,288 |
2,522 |
36 |
1,224 |
|
New Zealand |
74 |
2,700 |
879 |
807 |
18 |
531 |
|
Canada |
56 |
9,200 |
2,005 |
2,655 |
5 |
805 |
|
France |
42 |
3,600 |
1,907 |
2,256 |
28 |
858 |
|
Japan |
39 |
9,300 |
6,302 |
11,008 |
54 |
2,301 |
|
Germany |
37 |
800 |
284 |
217 |
np |
131 |
Ten per cent of assets in professional, scientific and technical services in Australia, or 71 per cent of all foreign-owned assets in the classification, are owned by 435 US firms in Australia. After accountants, the most common jobs in this sector are for software and application programmers, more in-demand jobs in the future economy. US-owned firms account for 55,800 Australian jobs in this sector, or six per cent of all workers in the entire industry across Australia. US firms account for 10 per cent of the entire industry’s contribution to Australia’s GDP.46
The manufacturing classification in Australia includes firms like Boeing, which manufactures advanced composite aerostructure components for commercial aircraft in Australia.
Table 6. Foreign investment in Australia’s manufacturing sector, 2014-2015
|
|
Operating businesses |
Employees |
Sales of goods and services ($m) |
Total assets ($m) |
Capital expenditure ($m) |
Industry value added ($m) |
|
United States |
244 |
40,500 |
44,843 |
101,738 |
1,980 |
11,174 |
|
New Zealand |
77 |
12,200 |
7,617 |
9,012 |
111 |
1,022 |
|
Japan |
75 |
11,700 |
12,596 |
18,701 |
318 |
1,995 |
|
United Kingdom |
60 |
19,400 |
15,942 |
10,412 |
367 |
3,953 |
|
Germany |
55 |
7,900 |
6,577 |
11,506 |
177 |
2,162 |
|
France |
37 |
7,200 |
4,371 |
4,886 |
83 |
881 |
|
Singapore |
25 |
4,100 |
2,666 |
5,524 |
87 |
640 |
|
Canada |
24 |
4,900 |
3,977 |
3,784 |
87 |
1,132 |
Twenty-one per cent of assets in manufacturing in Australia, or about half of all foreign-owned assets in this classification, are owned by some 244 US firms in Australia. And while the top employing occupation in Australia is “structural steel and welding trades workers,” other top jobs in the sector include production managers and machinists.47 With the proliferation of advanced manufacturing, employment in Australian manufacturing has grown in recent years and is expected to continue to do so.48 US-owned firms account for 40,500 Australian jobs in this industry classification, or about five per cent of all workers in the entire industry across Australia. US firms account for 11 per cent of the entire industry’s contribution to Australia’s GDP.49
Services trade
With the global trade of services continuing to expand at a faster rate than goods, the global economy is clearly becoming more services-orientated.50 Australia is no exception to this, with trade in services representing 22 per cent of Australia’s two-way trade but growing at a rate of 6.5 per cent over five years, compared to goods, which have grown at 4.5 per cent over five years. Australian services exports, in particular, have grown significantly, increasing at nine per cent over five years compared to the five-year increase in goods exports of 5.2 per cent.51
The United States is Australia’s largest two-way services trade partner, with US-Australian services trade totalling more than A$27 billion in 2018, an amount 27 per cent greater than Australia’s second-largest trading partner, China.
Figure 7. Australia’s two-way services trading partners, 1987-2019
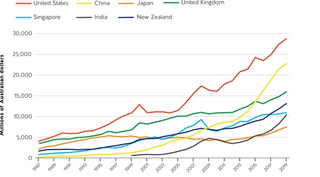
Figure 8. Australia’s two-way services trade, 2019
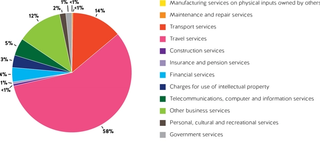
Figure 9. Australia’s total services trade with China, 2019 (left)
Figure 10. Australia’s total services trade with the United States, 2019 (right)
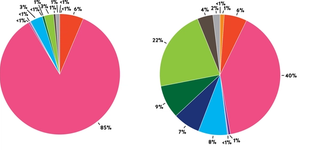
Yet in addition to its size, the United States is Australia’s most important services trading partner according to the Department of Foreign Affairs and Trade.52 This is perhaps because unlike Australia’s Asian trading partners, with whom services trade is dominated by foreign students and tourism, US services trade with Australia is dominated by future-orientated industries, most visible in three key areas: intellectual property charges (the use of patents, trademark and copyrights); other business services (comprised of R&D services, professional and management consulting services and technical, trade-related services); and telecommunications, computer and information services.
For more than 20 years, Australia’s trade in these three key service types has been larger with the United States than any other country.53 In 2017-2018, Australian exports of intellectual property to the United States grew 11 per cent from the prior year and totalled more than A$400 million — an amount more than five times the size of the next largest destination, the United Kingdom. And in 2018-2019, the United States imported A$3 billion worth of Australian business services and A$1.23 billion of Australian telecommunications, computer and information services.54
Figure 11. Australian exports of telecommunications, computer and information services, by destination, 2000-2019
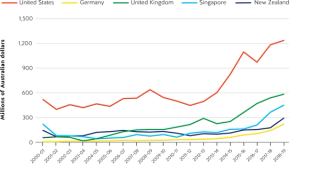
Figure 12. Australian charges for the use of intellectual property, by destination, 2000-2018
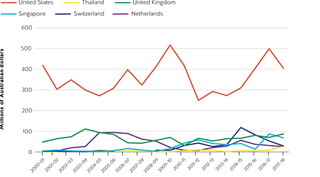
Figure 13. Australian exports of other business services, by destination, 2000-2019
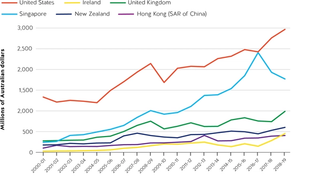
The reverse is true too, as Australia imports more intellectual property, business services, and telecommunications, computer and information services from the United States than anywhere else in the world.
The innovative links beyond trade and investment
In addition to extensive business links, the United States and Australia have also collaborated on path-breaking scientific work together for decades too.
US-Australian collaboration in space pre-dates the creation of NASA but led to Australia hosting the largest number of NASA tracking stations outside of the United States and enabling TV images of the first man on the moon to be shown throughout the world.55 In 2019, more than half a century later, the Morrison government allocated A$150 million to help Australian businesses get involved in the US mission to Mars.56 Australia’s world-renowned robotics and automation abilities in mining are expected to be integral to NASA’s current goal of extracting resources from the moon.57
Extensive ties and collaborations between the two nations in medical research have led to the United States being Australia’s top international collaborator in cancer research. And at the same time, Australia is the United States’ second-largest international collaborator in cancer research — only trailing Canada.58
US-Australian ties in science, technology and innovation have been supported by numerous bilateral and multilateral agreements involving the two countries.59

How some US allies and partners have invested in and harnessed innovation
In 2017-2018, Australia spent approximately US$22 billion on gross expenditure on R&D — ranking it 12th in the OECD, behind Turkey. Australia’s spending of 1.78 per cent of its GDP on R&D ranks it 21st in the OECD. Unsurprisingly Australia continues to fall in the Bloomberg Innovation Index rankings, placing 20th in 2020. Yet perhaps even more worryingly, Australia ranks 83rd in the world in economic complexity rankings. This is not the sort of economic resilience that will help Australia successfully navigate a global recession and a more contentious geopolitical environment due to US-China strategic competition.
Australia is not the only US ally or partner that has struggled with innovation. Australia is, however, becoming increasingly isolated among US allies and partners for not investing in innovation. As detailed here, select US allies and partners have recognised the perils of falling behind and acted accordingly.
Israel
Spend on R&D (2018): US$16,346 million (OECD rank: 15)
As a proportion of GDP: 4.95% (OECD rank: 1)
Bloomberg Innovation Index rank (2020): 6
Harvard Growth Lab Atlas of Economic Complexity ranking: 20
Strength: Venture capital attraction and R&D intensity
The case of Israel’s Yozma program in the mid to late 90s is often leaned on in studies of venture capital (VC) attraction. The emergence of large-scale VC investment in Israeli companies was a policy-enhanced process which built on already favourable conditions for growth and occurred in concert with several other beneficial external circumstances. The Yozma Program itself ran from 1993-1998 and made direct investments in more than 40 companies.60 The key to the scheme was that the Israeli Government offered to provide 40 per cent of the money raised by private investors in Israel. This ran in tandem to a direct investment program targeted at small, high-growth start-ups, primarily in the information communications and technology (ICT) sector. By 1996 the value of capital provided by the program raised reached US$263 million across ten public-private funds, which also attracted a permanent presence in Israel from more than 30 foreign VC firms predominantly hailing from the United States.61
The Yozma program enhanced long-running efforts to attract foreign capital in R&D in Israel, including the US-Israeli Binational Industrial Research and Development Foundation (BIRDf) founded in 1977 and the US-Israel Binational Science Foundation founded in 1972.
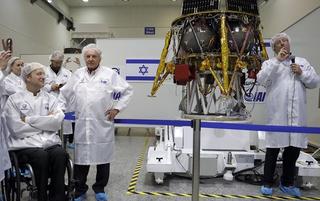
Although the United States has an extensive Binational Investment in Research and Development (BIRD) portfolio, joint US investment in science and technology and research and development in Israel, Pakistan, Egypt and India appear to be unique in that the funds for BIRD have been set aside by both countries in specific programs, rather than being issued on a case-by-case basis, or when a US-funded researcher identifies a foreign researcher or institution with which collaboration would benefit his or her research.62
The programs between Israel and the United States have been most effective, as they leveraged already strong personal and governmental links between the two countries, rather than attempting to create them.
The capital boost from Yozma, in addition to the pre-existing infrastructure of agreements, led to a cycle of innovation, imitation and competition, which all created the necessary supporting services for a successful R&D program. Along with an influx of skilled Russian immigrants and an increasingly globalised market,63 these five years established for Israel world-class innovation and R&D programs that thrived despite its relatively small size. Between 1998 — when the Israeli Government privatised the program — and 2000, Israel’s venture capital share of its GDP was above two per cent and the largest in the world.64 The inertia of the short-run Yozma program enabled the conditions in Israel for innovation to grow to a self-sustaining level equivalent to or even greater than a government incentive for attracting private foreign and domestic investment.
Germany
Spend on R&D (2018): US$129,770 million (OECD rank: 4)
As a proportion of GDP: 3.09% (OECD rank: 7)
Bloomberg Innovation Index rank (2020): 1
Harvard Growth Lab Atlas of Economic Complexity ranking: 4
Strength: Mechanical engineering and European networks
From the top down, Germany has placed an emphasis on R&D expenditure, while ensuring the right conditions exist to maximise capital contributions. With a goal of increasing the percentage of its GDP contributing to research and development to a massive 3.5 per cent by 2025, the German R&D efforts are constantly evolving.65 66
With a goal of increasing the percentage of its GDP contributing to research and development to a massive 3.5 per cent by 2025, the German R&D efforts are constantly evolving.
German efficiency is widely revered, and this has not been overlooked in studies of R&D and innovation. Germany constantly ranks in the global top tier of efficiency in delivering R&D output.67
Germany established a direct R&D tax incentive in January 2020. In April, the German Finance Ministry announced the incentive would be expanded to form part of its response to the COVID-19 pandemic and ensuing economic stress.68 Germany had been somewhat unique among developed countries in abstaining from tax incentives for R&D, but it did allow research costs to be deductible as regular business expenses for tax purposes.69 In lieu of this, the German approach to incentivising innovation and investment in R&D has been through large, targeted funding programs run on the local and national levels as well as the multinational level through the European Union. These cash grants and R&D loans can cover 25 to 75 per cent of R&D expenditures.
The high level of efficiency in the German research sector, a highly-educated and technically-skilled workforce, and the highly-advanced manufacturing sector that these generous grants and the strong EU link ultimately encourage other European multinationals to conduct their R&D in Germany through EU programs like the European Regional Development Fund. As such, Germany’s native capacity for R&D, as well as its international appeal constantly draws new actors into the German knowledge economy, reinforcing that native capacity and again increasing its international appeal.
South Korea
Spend on R&D (2018): US$95,462 million (OECD rank: 5)
As a proportion of GDP: 4.81% (OECD rank: 2)
Bloomberg Innovation Index rank (2020): 2
Harvard Growth Lab Atlas of Economic Complexity ranking: 3
Strength: Education and strong government support for R&D
The share of GDP accounted for by R&D in South Korea is a massive 4.81 per cent, having more than doubled since the mid-90s.70 The country’s heavy focus on science and technology stems back to the 1960s when its new revolutionary autocracy implemented the Korea Institute of Science and Technology and the Ministry of Science and Technology, establishing a strong link between public and private research and development.
The autocratic South Korean Government at this time built high tariff walls and pushed Korean manufacturing. Under these conditions, a number of hyper-powerful family-owned conglomerates — known as chaebols — came to dominate the market and were compelled to focus efforts on research and development. To assist in risky and uncharted ventures, these large conglomerates have been able to benefit from generous loans and tax incentives. Although the majority of R&D in Korea is business-driven, South Korea’s direct government funding for business R&D and tax incentives is among the highest in the OECD. In 2014, government support for business R&D was equivalent to 0.36 per cent of South Korea’s GDP.71
It is hard to understate the weight of the chaebols benefiting from these incentives in the nation’s economy: The top five chaebols alone (of which there are approximately 40) account for roughly half of South Korea’s stock market value.72 Remarkably high levels of collaboration between huge and diverse conglomerates and both government and academic institutions have allowed the pursuit of nation-building projects like successful efforts to push South Korea to the forefront of the world’s personal technology, automotive and shipbuilding industries.73
From an innovation standpoint, this market domination, as well as low levels of immigration, have not created what is traditionally considered to be an ideal innovation system: one which welcomes novel knowledge streams and rewards start-ups and small and medium-sized enterprises (SMEs). Instead, these smaller enterprises are often swallowed whole or forced out of the market by bigger players with problem-solving mindsets, rather than blue-sky thinking.74 Nonetheless, South Korea’s rigorous and world-renowned academic institutions and the highly-skilled workers these produce, in concert with a high level of government support for R&D and the abundant capital being invested by chaebols, has delivered the country a leading rank in measures of innovation.75
Case study: IBM
Key figure: R&D Research Lab hosts 150 scientists, software engineers and researchers from around the world researching everything from cloud computing and AI to quantum and blockchain
Innovative impact: Publishing more US patents than any other company for 27 years in a row; innovations for the Australian Taxation Office and Jetstar
NYSE: IBM
Headquarters: Armonk, New York
IBM began operations in Australia in 1932, 21 years after its founding in New York.
Today, IBM is one of the world’s largest employers, with operations in some 170 other countries. In Australia, IBM has some 5,000 employees across the country and offers services primarily to business and government customers that include hardware and software products as well as consulting and IT services.
Yet IBM’s remit in Australia is far wider than conventional business and government work — it also includes conducting cutting-edge research at its global R&D lab in Melbourne.
One of only 12 in the world, the Melbourne lab opened in 2011 amid bids from a number of other locations across the globe. Few multinational companies have more experience in wide-ranging R&D: IBM Research launched approximately 75 years ago and, unsurprisingly, IBM has been awarded more US patents than any other company for 27 years in a row.
According to IBM, the success of its R&D lab in Melbourne can be attributed to a collaboration of multiple stakeholders, including the Australian and Victorian governments as well as institutional support from industry and academia.
The staff of approximately 150 scientists, software engineers and researchers from around the world conduct extensive research on cloud computing and artificial intelligence as well as blockchain, cybersecurity, and quantum computing, among a range of others topics.
Melbourne is one of only three global cities to have two universities both ranked in the global top 20 biomedicine rankings, so taking advantage of its location within Melbourne’s life sciences cluster was a priority. As a result, the lab has initially focused extensively on life sciences research — on topics like epilepsy, use of the human eye as a sensor for monitoring health, and cancer treatments — but it has since evolved to a wider range of research areas. The lab’s partnership with the nearby University of Melbourne, for example, sought to accelerate research on quantum computing for applications in business and science.
According to IBM, the Melbourne lab works “closely with clients to understand their business challenges, innovation opportunities and how AI-powered solutions can be applied in real-life situations.” At the same time, however, the lab prioritises “conceiving, designing and building next-generation systems that will transform the industry.”
In practical terms, the R&D lab’s work ranges from blue-sky research to applied innovations, with results that include the Australian Taxation Office’s chatbot and the Jetstar customer check-in kiosk.
Policy recommendations
No country has played and continues to play a larger role in developing Australia’s innovative capabilities than the United States. With diverse services trade, future-orientated investment and multiple partnerships working on frontier science and technology issues, there is a lot for the United States and Australia to build upon.
But if one is to accept this argument, as well as the argument Australia is still not as innovative as it should be, then the question becomes how such US economic engagement with Australia can be expanded upon. In this instance, most of the onus lies on the Australian Government to institute the correct domestic policy settings.
Australia is not lacking in sweeping policy recommendations for improving its innovation ecosystem from top to bottom. This report, however, highlights the innovative-supporting economic engagement which can and should be expanded upon. The following policy recommendations should be understood as a means of supporting greater innovation in Australia generally, but sourced from the United States, in particular.
Imperative 1: Recognise the politically inconvenient truths of modern innovation
The most common innovation origin story takes place in someone’s garage on their days off from work or while they study in college. While this origin story is not entirely misplaced for many innovative firms, it nonetheless omits two critical pillars involved in modern innovation of most firms: anchor firms and venture capitalists.76 Of the eight US firms ranked within the top ten most innovative firms in the world by Forbes, venture capital or anchor firms were integral partners in every single one of them.77 Few, if any, of the innovative firms today were able to succeed without the involvement of one or both of them at some point in their development.
Of the eight US firms ranked within the top ten most innovative firms in the world by Forbes, venture capital or anchor firms were integral partners in every single one of them.
Australia is famously ranked near the bottom of the developed world in the commercialisation of its world-renowned research.78 Anchor firms and venture capital are integral to supercharging commercialisation. In a fiscally constrained environment in which government support for R&D is less certain than ever, these two pillars can step into the void resulting from decreased government support and engender both job creation and Australia’s sovereign capabilities.
As such, Australia should:
Recommendation 1: Actively seek out and support foreign anchor firms, not just small and medium enterprises
Multinational anchor firms have proven to be instrumental in supporting innovation in several ways, including:
- Spill-over of skillsets — regional workforces are upskilled by the introduction of world-leading multinational entities.79
- Commercialisation and development — small scale research can be developed and adopted by a multinational with extensive access to international markets.80
Yet Australian policymaking on innovation is overly focused on SMEs. In an environment in which foreign countries are engaged in a race to the bottom for attracting innovative jobs and companies, Australia should endeavour to both court, as well as maintain support for anchor firms in addition to SMEs. This support ranges from allowing open and impartial bidding on government tenders to allowing for innovation-focused incentives to not rule out larger firms. Extensive studies have proven anchor firms make local firms — particularly SMEs — more economically competitive and globally-orientated.81 Maintaining a protectionist framework that overly favours local SMEs will inevitably hurt Australia’s economy.
Recommendation 2: Actively seek out and support foreign venture capital in Australia
Australia is a well-known net importer of capital.82 While Australia has undoubtedly made major strides in recent years in attracting the sort of venture capital (VC) which is necessary to scale globally, it could undoubtedly use significantly more — particularly given the headwinds firms face in the current economic climate.83 Australian policymakers should look to incentivise sophisticated VC investors from overseas, particularly from the United States, to access world-leading expertise and to take advantage of the major source of capital.
The Australian Government can learn from the efforts of other nations like Israel in attracting and welcoming foreign venture capital firms.
Australian policymakers should look to incentivise sophisticated VC investors from overseas, particularly from the United States, to access world-leading expertise and to take advantage of the major source of capital.
Israel famously established its now thriving VC ecosystem through the Yozma program, which operated through government policy between 1993 and 1998,84 to create a competitive VC industry with critical mass, learn from foreign limited partners and acquire a network of international contacts.85 As a result, Israel now leads the world, including the United States, in VC investments as a percentage of GDP.86 Australia’s Early Stage Venture Capital Limited Partnerships program goes a little further than similar US tax incentives for VC firms, however, it could do more to attract more American VCs to establish offices in Australia.
Imperative 2: Increase economic alignment with the United States and allies
One of the late Senator John McCain’s many legislative accomplishments as the chairman of the US Senate’s Armed Services Committee was getting the National Technology and Industrial Base (NTIB) passed in Congress. This policy framework essentially allowed for a defence free-trade area among the defence-related research and development sectors of the United States, Canada, Australia and the United Kingdom.87 Ultimately, the framework promotes further interoperability among the United States’ closest allies in the defence realm.
Some have hoped such interoperability could occur more widely in the broader economy, beyond solely the defence sector. This would, however, likely increasingly turn into multilateral industrial policy which would be anathema to many democratic governments. Yet there are still critical steps that can be taken to increase coordination and partnerships which fall short of industrial policymaking.
These steps should reflect the need to:
Recommendation 3: Expedite “skinny deal” with the United States on e-commerce
The Australia-US Free Trade Agreement entered its 15th year of being in force in 2020. The agreement has provided a cornerstone to the ever-growing US-Australia economic relationship. The Trans-Pacific Partnership (TPP) provided a multilateral framework that would have both modernised the bilateral Australia-US agreement and provided an unprecedented incentive for China to address its widely criticised economic practices. Particularly in the absence of the United States joining the latest iteration of the multilateral agreement, Canberra and Washington should sign a “skinny deal” which is essentially the e-commerce chapter of TPP.
Such an agreement is relatively small in scope — it is expected to likely benefit small and medium Australian tech companies selling digital services to the US market because it sets basic digital standards, but it would nonetheless be a key step for US and Australian digital firms operating more seamlessly between the two countries.
Recommendation 4: Increase discussions on foreign investment and foreign interference legislation
In the last three years, Australia and the United States have both increased export control monitoring as well as restrictions on foreign investment. While Australia introduced unprecedented foreign interference laws, the United States began unprecedented prosecution of individuals who were caught lying to the FBI about their engagement with foreign entities.88 Harvard University’s Chemistry Department chair was the latest such individual to be arrested.89
US national security officials have not forgotten Australia’s surprise announcement about leasing the Port of Darwin to a Chinese company in 2015.90 With foreign investment facing unprecedented pressure from nationalist and protectionist forces, it is more important than ever for close allies to seek to align, or at least maintain a dialogue, on restrictions of foreign entities in their respective counties. The more the United States and Australia can maintain a dialogue on these efforts, the deeper their economic collaboration will be allowed to become on the sort of technologies which both nations are seeking to harness and work together on.
Recommendation 5: Engage technology standards bodies and negotiations
Traditionally, the development of technology standards is accomplished in a decentralised and industry-led manner. China has taken advantage of this and has become more active in setting industry standards across a range of technologies. Both Washington and Canberra need to be more active in the setting of industry standards, digital trade and internet governance protocols that mitigate the illiberal uses to technology.91
Both Washington and Canberra need to be more active in the setting of industry standards, digital trade and internet governance protocols that mitigate the illiberal uses to technology.
The standards that inform the use and adoption of new technologies related to automation and 5G will shape the playing field of global technology competition for years to come. For the sake of both economic resilience and national security, Canberra and Washington cannot sit idly by as these standards-setting discussions occur.
Recommendation 6: Support more regular analysis of Australian inbound and outbound investment
With global supply chains increasingly fraught by geopolitical forces, up-to-date economic statistics will become ever more critical for economic resilience. Unfortunately, however, the data sets currently available in Australia are too infrequent and too broad. For example, the Australian Bureau of Statistics (ABS) provides data on the economic activity of foreign affiliates in Australia and Australian affiliates abroad only once every 15 years. Even then, the ABS is only able to provide that data when extra funding is allocated from the Department of Foreign Affairs and Trade.
Australian policymakers cannot enact sufficient economic and national security policies if the underlying government statistics are unavailable or out of date. These statistics can help Australian policymakers better understand the cross-border flow of digital services and, therefore, the benefits or challenges of Canberra engaging in additional trade agreements involving digital services.
Imperative 3: Reconsider tired domestic debates
Analytical efforts to address Australia’s innovation challenge have become a cottage industry in and of themselves. Mentioning “patent box”, “visa regulations”, or “the R&D Tax Incentive” cues exasperated looks in Canberra. While some are inclined to give up on these long-debated issues, it is critical to resolve them as quickly as possible.
Engaging with firms doing innovative work in Australia demonstrates it is Australia’s domestic policies that determine — and often deter — foreign investment in the country’s most innovative sectors.
As such, Australia should make new efforts to:
Recommendation 7: Reconsider a patent box
Several OECD countries operate a patent box scheme in which companies with patents can apply for a lower corporate tax rate on income derived from those patents. Not having a patent box has hurt Australia’s innovative potential. Home-grown champion CSL made clear it would have reconsidered its 2014 decision to build a A$500 million plant with 500 jobs in Switzerland had a patent box in Australia been available.92 Some Australian reports have criticised the introduction of a patent box; these reports underestimate the potential positive impact of the box and the fact that the potential discount on the corporate tax rate need not be the size of other nations like the United Kingdom, where the patent box allows for a 50 per cent reduction of the corporate tax rate.
The continued absence of a patent box remains an unnecessary headwind for Australian innovation.
Recommendation 8: Increase skilled visas to benefit from closed borders elsewhere
The most in-demand resource underpinning Australia’s future economy will be knowledge and talent, not natural resources. Australia undoubtedly has extensive knowledge and talent resources, but their supply is not infinite. Innovative firms in Australia have made clear to Canberra they will not stay in an environment where skills-based visas are limited, cumbersome and inefficient.93 Instead of pushing them away, Australia should actively seek to retain talent, enabling them to create value and jobs in Australia. Extensive research has found foreign workers rarely take the jobs of citizens, on the contrary, they actually increase broader employment effects in the long term.94
Extensive research has found foreign workers rarely take the jobs of citizens, on the contrary, they actually increase broader employment effects in the long term.
Australia can learn from another US ally in this area. The Trump administration’s severe crackdown on immigration of all kinds has been a boon to Canada’s skilled migration regime.95 In a post-pandemic world with fewer barriers to international travel, Australia should follow Canada’s lead and actively seek out skilled talent for migration to Australia. While Australia developed approximately 1,200 new software engineers in 2018, Australian jobs in the sector increased by an average of nearly 11,000 every year from 2014 to 2019.96 Unlike other economic sectors, there are simply too many jobs and not enough qualified candidates to fill them.
Australia can ultimately choose to keep borders shut from skilled overseas talent and suffer the economic consequences, or it can recognise foreign workers in specific fields will lead to greater benefits for Australian firms and the country more broadly.
Recommendation 9: Maintain and stabilise the R&D Tax Incentive
This tax offset for companies undertaking R&D has been in existence since the 1980s but its utility has only decreased in recent years amid unprecedented uncertainty of the government’s intentions for the program.97 Numerous firms across innovative sectors of Australia’s economy have made it clear the R&D Tax Incentive (RDTI) is simply no longer used or relevant to them. Current proposals to change the RDTI would further erode the utility of the program.98
As long-running and convoluted as the debate on RDTI may seem, the primary challenge needing to be addressed is quite simple: the program needs both commitment and stability. The Australian Government must commit to a set number of years in which it will not only maintain the RDTI but also not alter it. The constant state of flux around and changes to RDTI decreased business certainty and, as a result, decreased the incentive of innovative firms to use it altogether. A smaller, but still helpful change to the program would be to increase the frequency of the payments. Even then, that is less a priority than commitment and stability.
RDTI is not a solution to all of Australia’s innovation woes, but it could be a key linchpin if it is made more stable. The Australian Government is by no means the only one facing such challenges — dozens of other countries have harnessed an RDTI more effectively than Australia, with Germany even doing so as recently as 2020.99 Even a quick analysis of global rates makes obvious some glaring lessons. Most notably Australia’s efforts of constantly tinkering with RDTI and ultimately watering it down does Australia no favours. Regardless, such efforts from overseas should be monitored closely by the Australian Department of Industry to glean lessons learned from the experience.
Imperative 4: Think creatively and locally
Recommendation 10: Use stamp duty waivers as incentives
State governments in Australia often complain their hands are tied regarding the most common challenges innovative firms want the government to resolve. But Australian state and local governments do have some authority to make a significant difference.
Most notably, state and local governments should become more adept at using creative incentives for significant investors into Australia. Major venture capital investors, for example, may be compelled to reside in an Australian state if that state can pledge to wave stamp duty fees on home purchases. Gaining access to the sophisticated capital provided by leading US venture capital firms would provide a major boost to commercialising Australia’s innovative sectors, while waiving stamp duty fees could be used in an agreement which would assure long-term investment and presence in Australia.
Conclusion
In an era where Australia is trying to navigate both the worst economic environment in modern history as well as ever-expanding strategic competition between the United States and China, Australia needs stability. With decades of diverse economic engagement and a robust security alliance, few economic relationships are more stable than that between the United States and Australia. Should Australia and the United States — both collectively and individually — choose to further integrate their economies, they will be all the stronger and more stable for it.
The United States Studies Centre is grateful for the financial support of Google Australia and Amgen Australia for this report.

