Executive summary
The financial crisis of 2008 led to a pronounced slowing in the growth of global trade, cross-border capital flows and other measures of globalisation. This slowdown has proved remarkably persistent, suggesting it may be more than just cyclical. The recent populist backlash against globalisation came after it had already slowed, suggesting it is the associated loss of economic dynamism rather than globalisation as such that is driving anti-globalisation sentiment.
Globalisation in Australia peaked in 2010-11 with the terms of trade boom and has declined modestly since then. Survey evidence shows that most people over-estimate the true extent of globalisation. While the reforms that internationalised the Australian economy in the 1980s and 1990s are still mostly viewed positively in Australia, economic reform has lost political momentum.
The recent populist backlash against globalisation came after it had already slowed, suggesting it is the associated loss of economic dynamism rather than globalisation as such that is driving anti-globalisation sentiment.
Protectionist and isolationist sentiment is never far below the surface of Australian politics. Immigration, in particular, is a potential catalyst for anti-globalisation sentiment, even though Australia ranks highly on opinion poll-based measures of migrant acceptance.
Australia’s international trade as a share of GDP is one of the lowest in the OECD. Australia is well integrated into global capital markets, but only ranks 17th on the MGI Financial Connectedness Ranking. Foreign investment in Australia and Australian foreign investment abroad is increasingly dominated by portfolio flows at the expense of direct investment. Australia maintains a relatively restrictive regulatory regime for foreign direct investment (FDI) based on the OECD’s measure of FDI restrictiveness.
At around 1 per cent of the population in the December quarter 2017, net overseas migration to Australia is not large by historical standards and only slightly above the post-war average of 0.7 per cent. Twenty-six per cent of the Australian population was born outside Australia based on the 2016 Census. This is only slightly higher than the 22.6 per cent share of foreign born at the time of the first Census in 1901, although the composition of the foreign-born population has changed over time.
While Australia has a high urbanisation rate, Australia’s largest city, Sydney, is only the 98th largest urban centre in the world by population, 40th largest by land area and 958th by urban population density. Increased urban density would enable Australia to better capture productivity gains from agglomeration effects.
Recommendations
Measures Australia can take to improve its openness to the rest of the world and capture the associated economic and social benefits from globalisation include the following:
- Continue to unilaterally lower tariff and non-tariff barriers with a view to eliminating barriers to trade in goods and abolish Australia’s anti-dumping system.
- Remove trade distorting subsidies and government procurement policies in line with Productivity Commission recommendations.
- Continue to pursue bilateral and plurilateral trade agreements, while working within the World Trade Organization to pursue multilateral agreements on specific issues such as digital commerce.
- Encourage the United States to re-join the Comprehensive and Progressive Agreement for Trans-Pacific Partnership (CPTPP).
- Facilitate the uptake of the provisions of free trade agreements by Australian business, particularly small-medium enterprises (SMEs).
- Lower barriers to digital commerce.
- Narrow the focus of Australia’s foreign investment screening process to national security considerations only, as recommended in the United States Studies Centre’s previous report, Deal-breakers? Regulating foreign direct investment for national security in Australia and the United States.
- Lower the corporate tax rate to 25 per cent, a rate more comparable to that of our largest investment partners, the United States and the United Kingdom, to increase foreign investment.
- Increase the size of Australia’s permanent migration program while liberalising housing supply and improving infrastructure.
- Facilitate temporary migration through a broader range of visa categories and increased visa numbers.
Introduction
The Australian economy experienced a dramatic opening-up to international competition during the 1980s and 1990s. The floating of the Australian dollar in 1983, the entry of foreign banks, the deregulation of interest rates, lowering of tariff barriers and move away from centralised wage fixing transformed the economy. Imports and exports as a share of the economy rose from around 25 per cent of GDP in the 1970s to around 45 per cent before the 2008 financial crisis. The economy’s strong performance since the early 1990s, including the absence of a conventionally-defined recession since 1991, is attributable at least in part to the increased resilience fostered by these reforms.

More recently, Australia has also entered into free trade agreements encompassing Australia’s most important trade and investment partners, including the United States (2005) and China (2015) (see Appendix for a list of agreements). These agreements should foster increased flows of goods, services, capital and people between Australia and the rest of the world. While providing the legal framework for increased integration with other economies, whether these connections actually improve depends on how the agreements are used. Openness on paper is not the same thing as openness in practice. Free trade agreements can also serve to divert trade to agreement partners at the expense of other economies, so that overall trade does not increase.
The empirical evidence overwhelmingly supports the theory that globalisation benefits not only economic growth and well-being as measured by average income per person, but also numerous other dimensions of human development. However, globalisation is not an unqualified good. Globalisation has implications for the distribution of income domestically and has been implicated in increased domestic income inequality even though it has unambiguously reduced income inequality at a global level. As Rodrik notes, “the result that trade openness creates losers is not a special case; it is the implication of a very large variety of models, including those where labour is not particularly mobile across industries and regions”.1 This can give rise to popular opposition to globalisation.
This report puts the openness and international connectedness of the Australian economy into historical and comparative perspective. Understanding these trends is important for public perceptions of globalisation and how these perceptions inform public policy.
Given the magnitude of the positive shock to global labour supply from the entry of formerly closed socialist economies into the world economy from 1978 onwards, it is perhaps surprising that the dislocation in other economies has not been larger and the populist backlash even greater. Ironically, the more recent populist backlash against globalisation since 2016 has only come with the post-financial crisis slowing in the pace of globalisation, reflecting subdued economic conditions in some countries in the post-crisis period. Although the world economy has picked-up more recently, globalisation has not recovered its pre-crisis pace. This suggests that it is a loss of economic dynamism that is the main driver of anti-globalisation sentiment rather than globalisation per se. Increased economic dynamism is the best way to counter populist and protectionist politics. Promoting economic openness and international connectedness is a proven recipe for economic growth, whereas protectionist policies are associated with economic stagnation. Policies that promote the flexibility of the domestic economy, including greater labour mobility, are also important in helping the economy to adjust to the external shocks that come with globalisation.
This report puts the openness and international connectedness of the Australian economy into historical and comparative perspective. Understanding these trends is important for public perceptions of globalisation and how these perceptions inform public policy. The report sets benchmarks for monitoring the future evolution of Australia’s connections with the rest of the world against the backdrop of an outbreak of protectionism internationally. It examines the following dimensions of globalisation and international connectedness:
- Composite measures of globalisation based on a broad range of economic, social and political indicators
- Trade in goods and services
- Barriers to trade in goods and services
- Digital trade restrictiveness
- Trade in capital
- Barriers to trade in capital
- Majority foreign-owned business in Australia
- International taxation
- Economic policy uncertainty
- Immigration.
The report finds that the globalisation of the Australian economy peaked in 2010-11 along with the terms of trade boom and that it has become slightly less open since then. Both cyclical and structural factors explain these changes. The concluding section of the report makes recommendations to improve Australia’s international connectedness in ways that are likely to promote economic and social welfare. The report does not make a comprehensive case for these policies, although references other literature that does. The common theme to these policy recommendations is that they work in large part by increasing the openness of the Australian economy.
Globalisation and the Australian economy
Australia is not alone in its experience of increased globalisation in recent decades. There was rapid growth in globalisation and international connectedness in many countries during the 1980s and 1990s. This coincided with the Great Moderation, a period of reduced volatility in economic growth and inflation during the 1990s and 2000s until the onset of the global financial crisis in 2008. However, this does not mean that globalisation caused the Great Moderation. It is also possible that more stable macroeconomic conditions provided an environment that was more conducive to policies that increased openness.
The financial crisis led to a pronounced slowing in the growth rate of global trade, cross-border capital flows and other measures of globalisation. After four decades of growing one-and-a-half times faster than global GDP before the crisis, growth in trade slowed to less than that of GDP in its aftermath.2 This slowdown has proved remarkably persistent, suggesting it may be more than just cyclical. The former secular trend in favour of increased globalisation may have suffered a permanent setback as a result of the financial crisis.
The globalisation trend has been associated with the largest reduction in global poverty in human history. According to the World Bank, the number of people living in extreme poverty has fallen by one billion in the last 25 years.
The empirical evidence supports the theory that globalisation benefits not only economic growth and well-being as measured by average income per person, but also numerous other dimensions of human development.3 Greater openness is associated with increased productivity.4 The globalisation trend has been associated with the largest reduction in global poverty in human history. According to the World Bank, the number of people living in extreme poverty has fallen by one billion in the last 25 years.5 As of 2018, a global tipping point has been reached whereby, for the first time in human history, the majority of the world’s population are no longer poor or vulnerable to poverty.6
Policymakers should aim to increase openness and international connectedness where it shows tangible economic and social benefits. Restrictions on trade and other cross-border flows should only be put in place where there is clear public policy rationale and benefit and not at the behest of sectional interests seeking protection from international competition.
Globalisation is not an unqualified good. The distributional consequences of increased openness within individual countries is more mixed than at a global level and this can undermine domestic political support for globalisation. While the winners from globalisation can, at least in principle, compensate the losers, the associated increases in taxes and fiscal transfers can be costly in themselves and may not take place in practice. The shock to global labour supply from the entry of China and the former socialist economies of Eastern Europe and Soviet Union into the world economy has adversely affected some workers in advanced economies. Increased cross-border capital flows can amplify domestic capital market imperfections, leading to an increased incidence of banking and financial crises.7
As early as 1997, scholars like Dani Rodrik were questioning whether globalisation had gone too far.8 The protests against the World Trade Organization Ministerial Conference in Seattle in 1999 were an early manifestation of anti-globalisation sentiment. The civil society campaign against the OECD’s Multilateral Agreement on Investment, also in the late 1990s, was another manifestation.9 The mid-2000s were perhaps the high point of pro-globalisation sentiment, as exemplified by two books published in 2004: Martin Wolf’s Why Globalization Works,10 and Jagdish Bhagwati’s In Defence of Globalization.11 However, as their somewhat defensive sounding titles suggest, these books were written largely in response to globalisation’s critics.
In 2007, Thirlwell prophetically observed that ”some of the world’s leading economies are having second thoughts about globalisation”.12 These second thoughts were occasioned as much by globalisation’s successes as its failures, in particular, the rise of China and India. Thirlwell noted “the possibility that the country which has done the most to promote the current global economy [the United States] may rethink its stance towards globalisation would represent a big change in the international economic environment”.13
Globalisation is not an unqualified good. The distributional consequences of increased openness within individual countries is more mixed than at a global level and this can undermine domestic political support for globalisation.
That big change arrived in 2016, not just with the election of President Trump in the United States, but also the Brexit referendum in the United Kingdom. Ironically, the recent popular backlash against globalisation came only in the wake of the pronounced slowing in the pace of globalisation since 2008. The slow recovery from the crisis due to domestic economic policies has arguably done more to promote anti-globalisation sentiment than globalisation itself. Nor can the backlash be explained by reference to growing inequality. Inequality in the United States, for example, was rising faster in the 1980s and 1990s than more recently.14
Surveys show that the public dramatically overestimates the true extent of globalisation and international connectedness.15 These misperceptions drive anti-globalisation sentiment, highlighting the need to put globalisation in proper perspective. At the same time, opinion polls suggest that the public remains favourably disposed to international trade. In Australia, 88 per cent of those polled say ‘growing trade and business ties with other countries is a good thing for our country,’ in line with the median survey response in advanced economies of 87 per cent. In the United States, only 74 per cent view such ties as ‘good’, although this percentage has actually increased in recent years. Favourable views of trade are positively correlated with average GDP growth on a cross-country basis.16
While the reforms that internationalised the economy in the 1980s and 1990s are still viewed positively in Australia, economic reform has lost political momentum. Protectionist and isolationist sentiment is never far below the surface of Australian politics. Immigration, in particular, is a potential catalyst for anti-globalisation sentiment, even though Australia ranks very highly on opinion poll-based measures of migrant acceptance.17 Australian politicians have successfully navigated the politics of immigration for many decades, but public policy failures in housing supply and infrastructure could undermine the bipartisan consensus in favour of immigration. Australian politicians could be tempted to blame foreigners and Australia’s openness to the rest of the world for their policy failings at home, putting the openness of the Australian economy at risk.
Around 70 per cent of the variation in a country’s openness and international connectedness is explained by structural characteristics such as country size, geographical location and the level of economic development.18 Australia’s international goods and services trade as a share of the economy is one of the lowest in the OECD. This is partly attributable to Australia’s geographical isolation, size and large services share of overall output, although policy choices by the Australian government also play a role.19 As the centre of gravity of the world economy moves closer to Australia with the growth of the Chinese, Indian and other regional economies, geographical isolation should become less important and the ratio of international trade to output should increase, all else being equal, but policymakers need to do more to ensure that Australia connects to this shift in the world’s economic geography. Some of the ways in which the government currently limits Australia’s interactions with the rest of the world and how these restrictions might be reformed are detailed further in this report.
Has globalisation peaked? Composite measures of globalisation and international connectedness
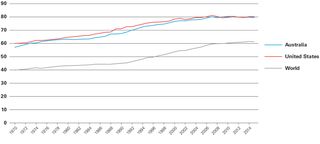
The KOF Globalisation Index measures the level of globalisation internationally and at a country level based on economic, social and political measures.20 The index for Australia, the United States and the world is shown in Figure 1, where a higher value of the index represents increased globalisation. The index shows that globalisation increased rapidly from 1990 until the onset of financial crisis in 2008, before flattening out. In 2015, the global index decreased modestly for the first time since 1970.21
Figure 1: KOF Globalisation Index
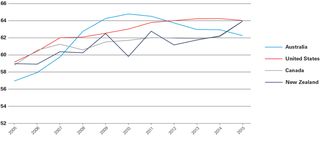
The DHL Global Connectedness Index seeks to measure a similar set of indicators to the KOF index. It shows global connectedness regaining its pre-financial crisis peak in 2014, but slowing again in 2015.22 The DHL index for Australia and peer economies is shown in Figure 2.
Figure 2: DHL Global Connectedness Index
Both measures are consistent with the view that the overall globalisation trend has slowed in the years since the financial crisis. This trend was struggling even before the populist backlash that manifested in the Brexit referendum in the United Kingdom and the election of President Trump in the United States in 2016. A key question is whether this cyclical downturn represents a more permanent reversal of the trend towards increased globalisation since around 1990.
The KOF measure for Australia shows a rapid increase in globalisation from the early 1990s, peaking in 2011 with the terms of trade boom and following a flat trend since. The decline in the US measure with the onset of the financial crisis in 2008 has enabled Australia to match the United States since then. Australia is somewhat less globalised than Canada, although more so than New Zealand. Australia ranked 27th most globalised on the overall index in 2015.
State of confusion: How policy uncertainty harms international trade and investment

The DHL Global Connectedness Index has Australia recording a peak in its connectedness score in 2010, similar to the timing of the peak in the KOF Index, before drifting lower through to 2015. In terms of rank, Australian has declined on this measure from 24th to 34th most connected since 2010, behind peer economies such as the United States (27th), Canada (30th) and New Zealand (29th). Australia’s connectedness ranking declined on every dimension of the index over this period except “people”, reflecting increased inward migration and tourism.
Australia has participated in the trend to a more subdued pace of globalisation in recent years. Australia is less globalised and connected than it was at the beginning of the decade in absolute terms. While Australia outperformed peer economies in the years immediately following the financial crisis on the DHL Index, it has slipped and underperformed more recently.
Table 1 compares Australia and the United States along key dimensions of globalisation, based largely on the DHL Index. While both countries show a similar level of overall globalisation, they differ along several dimensions. Australia outperforms on measures of the depth of its international connections, but it underperforms on measures of breadth. While Australia outperforms on the people and information dimensions, it underperforms on the capital and trade dimensions. The rest of this report takes a more detailed look at the data underlying these and other measures of globalisation.
Table 1: Globalisation in Australia and the US compared
|
DHL Global Connectedness Index scores, 2016 [a] |
Australia |
United States |
|
Overall |
62 |
64 |
|
Depth [b] |
20 |
17 |
|
Breadth [c] |
42 |
47 |
|
Trade pillar |
45 |
48 |
|
Capital pillar |
66 |
74 |
|
Information pillar |
86 |
84 |
|
People pillar |
77 |
62 |
|
Trade |
|
|
|
Merchandise trade (inward) (% GDP) |
17 |
13 |
|
Merchandise trade (outward) (% GDP) |
15 |
8 |
|
Services trade (inward) (% GDP) |
4 |
3 |
|
Services trade (outward) (% GDP) |
4 |
4 |
|
Trade shares of GDP |
40 |
28 |
|
Capital |
|
|
|
International financial integration ratio (total foreign assets and liabilities % GDP) |
298 |
278 |
|
FDI stock (% GDP) (inward) |
44 |
31 |
|
FDI stock (% GDP) (outward) |
32 |
33 |
|
FDI flows (% domestic investment) (inward) |
10 |
7 |
|
FDI flows (% domestic investment) (outward) |
-2 |
9 |
|
Portfolio equity stock (% of market capitalisation) (inward) |
28 |
24 |
|
Portfolio equity stock (% of market capitalisation) (outward) |
31 |
26 |
|
Portfolio equity flows (% of market capitalisation) (inward) |
1 |
0 |
|
Portfolio equity flows (% of market capitalisation) (outward) |
1 |
1 |
|
Information |
|
|
|
Internet bandwidth (bits/second/internet user) |
81,564 |
99,017 |
|
Internet phone calls (minutes/capita) (inward) |
237 |
107 |
|
Internet phone calls (minutes/capita) (outward) |
240 |
421 |
|
Printed publications trade (USD/capita) (inward) |
34 |
14 |
|
Printed publications trade (USD/capita) (outward) |
8 |
15 |
|
People |
|
|
|
Migrants (% of population) (inward) |
28 |
14 |
|
Migrants (% of population) (outward) |
2 |
1 |
|
Tourists (dep./arr. per capita) (inward) |
- |
0.2 |
|
Tourists (dep./arr. per capita) (outward) |
0.4 |
0.2 |
|
International students (% of tertiary education enrolment) (inward) |
18 |
4 |
|
International students (% of tertiary education enrolment) (outward) |
1 |
0 |
|
Globalisation policies |
|
|
|
Enabling Trade Index [d] |
4.9 |
5 |
|
Tariffs (weighted mean applied) |
1.9 |
1.4 |
|
Capital account openness [e] |
0.9 |
1.4 |
|
Visa-free travel outward [f] |
168 |
172 |
|
Visa-free travel inward [g] |
31 |
6 |
Trade in goods and services: Australia one of the OECD’s least open economies
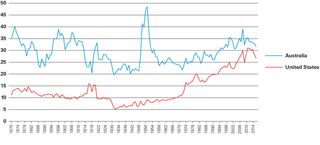
Australia’s international trade as a share of GDP is one of the lowest in the OECD. Only the large economies of Japan and the United States have lower trade shares.23 As already noted, this is largely attributable to structural characteristics of the Australian economy such as geography and size, although trade policy restrictions also play a role.24 There is also cyclical variation in the ratio over time, with economic downturns at home and abroad reducing the trade share. Imports and exports of goods and services peaked at around 45 per cent of GDP before the onset of the financial crisis, having risen fairly steadily from a low of around 25 per cent in the early 1970s, based on ABS data.
Using historically consistent data to make long-run comparisons, Australia’s trade share of GDP is currently around its long-run average since 1870 of 30 per cent of GDP (Figure 3).25 Australia had a larger trade share during the Korean War boom, but also for much of the late 19th and early 20th centuries during the first era of globalisation that came to an end with the First World War. The opening up of the Australian economy in the 1980s and 1990s only served to recover the trade share of that earlier era.
Figure 3: International trade (% GDP)
The lack of a significant increase in the trade share since the crisis of 2008 is consistent with the global slowdown in world trade. The growing number of free trade agreements Australia has entered into covering major trading partners should yield an increase in Australia’s trade with the rest of the world over time, net of trade diversion effects (see Appendix for a list of free trade agreements). Free trade agreements should also see an increase in foreign affiliate sales by Australian firms abroad and foreign firms in Australia that do not appear in international trade statistics. These sales are indirectly reflected in foreign direct investment statistics. The growing importance of digital trade may also be under-represented in cross-border trade statistics.
Barriers to trade in goods and services: Creeping protectionism
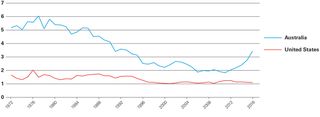
Taxes on international trade have been rising as a share of government revenue in recent years, from 1.8 per cent in 2011-12 to 2.9 per cent in 2016-17, although this reflects changes in both the tax base (trade volumes and values) and tax (tariff) rates.26 The World Bank’s measure of trade-related taxes for Australia shows a similar upward trend in recent years (Figure 4).27 Trade taxes are higher as a share of government revenue in Australia than in the United States, reflecting Australia’s larger traded goods share of GDP.
Figure 4: Taxes on international trade as % of government revenue
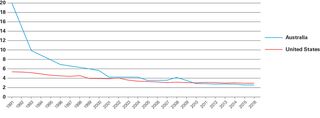
Australia’s tariff barriers were lowered dramatically in the early 1990s. The simple average of Australia’s tariff rates as of 2016 was 2.5 per cent compared to 19 per cent in 1991, bringing them broadly in line with the United States, according to the WTO (Figure 5). These data pre-date the most recent tariff increases in the United States.
Figure 5: Simple average tariff rate (%)
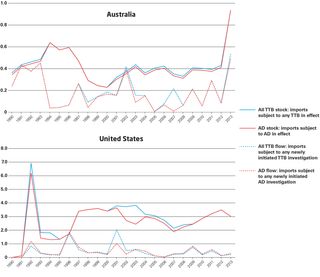
Like other countries, Australia has made increasing use of anti-dumping (AD)/countervailing duties (CVD), trade distorting subsides and non-tariff barriers as a substitute for tariff protection. Changes to Australia’s anti-dumping regime made by successive governments have made it easier for domestic firms to bring anti-dumping actions for protectionist purposes.28 This has seen a surge in anti-dumping actions covering a growing share of Australia’s imports. According to the Global Anti-Dumping Database, the stock of Australia’s temporary trade barriers (TTBs) covered around 1 per cent of imports in 2013, having increased in the wake of changes to Australia’s anti-dumping system. This is a smaller share than the three percent of US trade-weighted imports covered by TTBs (Figure 6).
Figure 6: Import coverage by all TTBs and anti-dumping only, trade weighted (%)
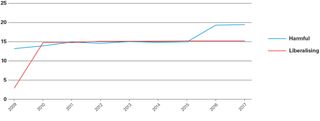
The Global Trade Alert database29 monitors a broad range of trade distorting and trade liberalising measures introduced since the 2008 financial crisis, including subsidies and procurement policies. Australia’s harmful interventions covered 19 per cent of its imports in 2017, an increase from 13 per cent in 2009. Australia’s liberalising measures covered 15 per cent of imports in 2017 compared to 3 per cent in 2009 (Figure 7).
Figure 7: Harmful and liberalising trade interventions by Australia, share of imports from rest of world covered (%)
Australia could increase the openness of its economy and lower costs for consumers and business by abandoning its anti-dumping system, as recommend by the Garnaut Report in 199030 and the Productivity Commission in 2016.31 Australia could also repeal other trade distorting policies and subsidies as identified by the Productivity Commission’s regular industry assistance reviews.
Digital trade restrictiveness: A middling performance
Digital trade is of growing importance to the world economy and is an important facet of globalisation, but is not fully captured by international trade and investment statistics. However, attempts have been made to measure policy and other barriers to digital trade.
The Digital Trade Restrictiveness Index32 measures policy restrictions on digital trade for 64 countries, including Australia. The index takes values between 0 (completely open) and 1 (completely closed). Australia scores 0.23 on the index, close to the average value of 0.24 across the 64 countries, leaving it ranked 27th most restrictive on this measure. Australia is more open than the United States (0.26 and 22nd most restrictive), but less open than New Zealand, the least restrictive jurisdiction at 0.09 (64th) (Figure 8). Australia’s middling ranking on this measure suggests scope to improve openness to digital trade in both absolute terms and relative to other economies. Openness to digital trade should be an important agenda item in Australia’s free trade agreement negotiations.
Figure 8: Digital Trade Restrictiveness Index — 2016
1 = completely closed, 0 = completely open

Australia’s broadband internet speeds are ranked 53rd internationally,33 which helps explain Australia’s poor ranking on measures of internet bandwidth. The government monopoly National Broadband Network acts as a barrier to digital trade by increasing the cost of accessing the internet.
Australia’s trade in capital: A flattening trend
Since the financial crisis, global gross cross-border capital flows have fallen by 65 per cent in absolute terms and by four times relative to world GDP. The decline in capital flows reflects a narrowing in current account imbalances over the same period, including in Australia. The global stock of foreign investment is little changed since 2007, when it peaked at 185 per cent of world GDP. However, adjusting for flows passing through international financial centres, which leads to double-counting, the global foreign investment share of GDP falls to a more modest 140 per cent as at 2016.34
Australia has long depended on imports of capital to fund domestic investment spending in excess of domestic saving. The floating of the Australian dollar and financial deregulation in the early-mid 1980s facilitated increased foreign capital inflows, but also Australian foreign investment abroad. Australia is well integrated into global capital markets, but only ranks 17th on the MGI Financial Connectedness Ranking based on the US dollar sum of its foreign assets and liabilities, below the United States ranked 1st and Canada ranked 12th.35
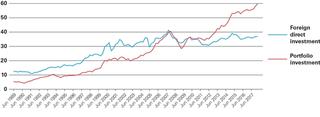
The International Financial Integration (IFI) ratio shows the sum of the stock of foreign investment in Australia and Australian investment abroad as a share of GDP (Figure 9). The ratio declined during the financial crisis before recovering and posting new highs around 2015, only to flatten out again in recent years. Both foreign assets and foreign liabilities exhibited an upward trend as a share of GDP until 2015, before levelling off as part of a global slowing in cross-border capital flows. Growth in inward and outward portfolio investment has outperformed growth in FDI, for which it is a substitute (Figures 10 and 11).36 This may reflect barriers to foreign direct investment discussed below, meaning that Australia is foregoing some of the economic benefits that attach uniquely to FDI, but not other forms of foreign investment.
Figure 9: International Financial Integration Ratio — Australia, sum of foreign assets and liabilities (% GDP)
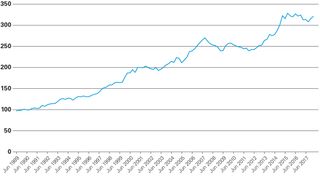
Figure 10: Foreign investment in Australia (stock, % GDP)
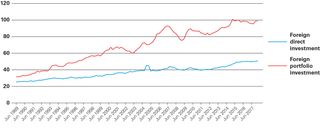
Figure 11: Australian foreign investment abroad (stock, % GDP)
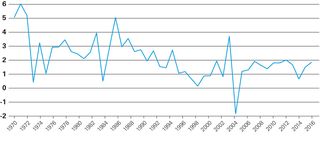
Australia’s share of global inward FDI has for the most part been larger than its share of GDP, but the ratio has been on a declining trend since 1970, reflecting great reliance on portfolio investment flows driven by Australian and international financial deregulation (Figure 12).
Figure 12: Australia’s global inward FDI share/global GDP share (%, current prices)
Australia’s financial integration with the rest of the world has recovered from its downturn during the financial crisis, but has slowed again more recently. This suggests Australia needs to turn its attention to regulatory and other barriers to trade in capital to maximise the opportunities represented by foreign investment. The negotiation of new free trade agreements provides an opportunity to review these policy settings. A Productivity Commission review of barriers to cross-border capital flows would complement its recent work on barriers to services exports.
Barriers to trade in capital: Capital xenophobia
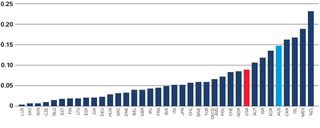
Portfolio investment flows freely between Australia and the rest of the world, with Australia having an open capital account and maintaining few capital controls, at least with respect to foreign portfolio investment. Australia’s inward foreign direct investment is screened for transactions deemed ‘contrary to the national interest’.37 Australia maintains a relatively restrictive regime based on the OECD’s measure of FDI restrictiveness. Australia’s restrictiveness score is above the OECD average and above the United States, although Australia is more open than New Zealand or Canada (Figure 13).38 The United States Studies Centre’s report Deal-breakers? Regulating foreign direct investment for national security in Australia and the United States suggests ways in which the regulation of FDI in Australia could be further liberalised by focusing the Foreign Investment Review Board process on national security as in the United States and leaving other policy issues to behind the border regulation on a national treatment basis.39
Figure 13: OECD FDI Restrictiveness Index (0 = completely open, 1 = completely closed)
Majority foreign-owned businesses in Australia: A growing share
The ABS periodically surveys foreign-owned businesses in Australia when funded to do so by the Department of Foreign Affairs and Trade and the Australian Trade and Investment Commission. Foreign affiliate activity is not captured in conventional trade statistics, which are based on goods and services crossing borders, although it is captured indirectly through foreign investment statistics. This activity is summarised in Table 2. Majority foreign-owned businesses have increased their activity in Australia along most measures since 2010-11, with the exception of profits and liabilities. Table 3 shows the share of foreign and total business activity in 2014-15 attributable to US-owned firms.
Table 2: Foreign business activity in Australia (greater than 50 per cent foreign ownership), share of total business activity (%)
|
|
Operating businesses |
Employment |
Sales of goods and services |
Total operating expenses |
Operating profit before tax |
Taxable profit |
Profit after tax |
|
2010/2011 |
0.4 |
7.6 |
20.7 |
17.7 |
12.4 |
11.3 |
12.6 |
|
2011/2012 |
0.4 |
7.9 |
21.8 |
18.1 |
12.6 |
11.3 |
13.0 |
|
2012/2013 |
0.4 |
8.4 |
22.7 |
18.8 |
13.7 |
11.8 |
13.2 |
|
2013/2014 |
0.5 |
8.7 |
23.1 |
20.2 |
13.4 |
13.0 |
13.5 |
|
2014/2015 |
0.5 |
8.7 |
24.2 |
20.6 |
12.4 |
11.3 |
12.7 |
|
5-yr change |
0.1 |
1.1 |
3.5 |
2.9 |
0.0 |
0.0 |
0.1 |
|
|
Compensation of employees |
Contractors and commissions |
Total assets |
Total liabilities |
Capital expenditure |
Exports of goods and services |
Industry value added |
|
2010/2011 |
10.4 |
15.3 |
17.4 |
17.7 |
11.8 |
26.3 |
18.4 |
|
2011/2012 |
10.9 |
16.6 |
17.5 |
17.2 |
14.0 |
26.0 |
18.8 |
|
2012/2013 |
10.7 |
18.0 |
17.8 |
17.4 |
14.9 |
29.8 |
20.0 |
|
2013/2014 |
11.7 |
19.1 |
18.0 |
17.6 |
12.6 |
28.2 |
19.7 |
|
2014/2015 |
11.9 |
20.2 |
18.0 |
17.3 |
12.4 |
29.4 |
20.8 |
|
5-yr change |
1.5 |
4.9 |
0.6 |
-0.4 |
0.6 |
3.1 |
2.4 |
Table 3: US business activity in Australia, 2014-15
|
|
Operating businesses |
Employment |
Sales of goods and services |
Total operating expenses |
Operating profit before tax |
Taxable profit |
Profit after tax |
|
Country of origin |
No. |
'000s |
$m |
$m |
$m |
$m |
$m |
|
United States |
2,039 |
273 |
210,359 |
85,141 |
13,280 |
9,508 |
10,475 |
|
Total foreign |
9,946 |
966 |
770,395 |
314,127 |
49,530 |
31,358 |
40,280 |
|
Australia |
2,055,445 |
10,084 |
2,408,148 |
1,210,145 |
349,756 |
246,364 |
277,078 |
|
Total |
2,065,391 |
11,050 |
3,178,543 |
1,524,272 |
399,286 |
277,723 |
317,358 |
|
US share of foreign firm activity (%) |
20.5 |
28.2 |
27.3 |
27.1 |
26.8 |
30.3 |
26.0 |
|
US share of total business activity (%) |
0.1 |
2.5 |
6.6 |
5.6 |
3.3 |
3.4 |
3.3 |
|
|
Compensation of employees |
Contractors and commissions |
Total assets |
Total liabilities |
Capital expenditure |
Exports of goods and services |
Industry value added |
|
Country of origin |
$m |
$m |
$m |
$m |
$m |
% |
$m |
|
United States |
19,434 |
5,589 |
593,362 |
466,919 |
13,920 |
36.8 |
71,614 |
|
Total foreign |
67,315 |
21,971 |
1,927,737 |
1,585,742 |
43,141 |
100.0 |
221,916 |
|
Australia |
498,638 |
86,892 |
8,803,412 |
7,598,838 |
304,277 |
100.0 |
846,136 |
|
Total |
565,953 |
108,863 |
10,731,149 |
9,184,579 |
347,419 |
200.0 |
1,068,052 |
|
US share of foreign firm activity (%) |
28.9 |
25.4 |
30.8 |
29.4 |
32.3 |
36.8 |
32.3 |
|
US share of total business activity (%) |
3.4 |
5.1 |
5.5 |
5.1 |
4.0 |
18.4 |
6.7 |
International taxation: Australia increasingly uncompetitive
The tax system can serve as a barrier to trade in goods, services, capital and labour. Australia ranks 8th out of 35 countries on the Tax Foundation’s Index of International Tax Competitiveness, but only 27th for its corporate tax rate and 17th on international tax rules.40
Australia’s corporate tax rates of 27.5 per cent and 30 per cent (depending on firm turnover) are above the OECD average rate of 23.7 per cent and the US rate of 21 per cent.41 Australia’s failure to lower its corporate tax rate for all companies to match similar reductions overseas is likely to inhibit inward foreign direct investment in particular.
As a large net importer of capital, foreign investors are the marginal investor in Australia. Lowering Australia’s corporate tax rate to 25 per cent, to be more comparable with Australia’s two largest investment partners, the United States and the United Kingdom, could be expected to increase foreign investment in Australia. Treasury’s analysis points to a 0.8 per cent long-term gain in gross national income from a reduction in the corporate tax rate to 25 per cent.42
Economic policy uncertainty: State of confusion
Economic policy uncertainty can act as a de facto trade barrier. The United States Studies Centre report, State of confusion: How policy uncertainty harms international trade and investment,43 quantifies the impact of economic policy uncertainty on Australia’s trade and investment volumes. The effects of economic policy uncertainty on trade volumes and FDI are not statistically significant, but there is a statistically significant negative effect on inward foreign portfolio investment. A one standard deviation increase in economic policy uncertainty in Australia lowers foreign portfolio investment by 0.8 per cent after three quarters. The State of confusion report contains policy recommendations for reducing economic policy uncertainty. These include increased use of rules-based approaches to policy formulation and implementation.
Immigration: Large potential gains from increased cross-border labour mobility
Cross-border migration flows are an important aspect of globalisation. There are well-established complementarities between trade, investment and immigration, although they can sometimes also be substitutes.44 It is no coincidence that the first era of globalisation from 1870 to 1914 broadly coincided with the age of mass migration from 1840 to 1914. The percentage of migrants as a percentage of the world population was little changed between 1900 and 1990. However, the period of increased globalisation during the 1990s saw an increase in migration due to the collapse of the former Soviet Union and the advent of visa-free movement in the European Union. Whereas the global stock of migrants ranged between 2.1 per cent and 2.3 per cent of the global population between 1960 and 1990, this has increased to around 3 per cent more recently, excluding refugees.45
Both population growth and immigration have significant economic, as well as social benefits.46 In addition to boosting the productive capacity of the economy, population growth and immigration are spurs to innovation and productivity.47 Urban density drives agglomeration effects that increase productivity and skilled migrants tends to concentrate in the most productive urban areas.48 Australia benefits from a relatively high percentage of its population living in urban areas, although its urban density is relatively low. Australia’s largest city, Sydney, is only the 98th largest urban centre in the world by population, but 40th largest by land area and 958th by urban population density.49

Migration remains much more tightly regulated than other forms of international trade. Permanent and temporary migration quotas and complex visa processes can be viewed as barriers to trade in labour. As a result, migration flows have not seen the same international trend to greater openness shown by trade in goods, services and capital, notwithstanding the increased flows associated with the increased integration of the European Union and the collapse of the Soviet Union.
There are consequently very large potential gains from liberalising international migration and increasing cross-border labour mobility. By one estimate, the prospective welfare gains from complete cross-border labour market liberalisation are in the range of 50 per cent to 150 per cent of world GDP. The emigration of less than 5 per cent of the population of poor countries to the developed world would yield welfare gains greater than the total elimination of all remaining barriers to trade in goods and capital.50
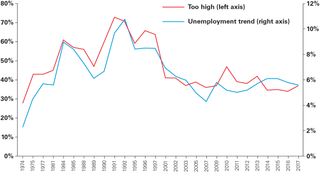
The politics of increased migration can be fraught, although it is worth noting that Australia ranks 6th out of 138 countries for migrant acceptance based on Gallup’s Global Migration Index.51 The percentage of survey respondents saying that immigration is ‘too high’ is positively related to the unemployment rate in Australia (Figure 14).52 Sound economic management is important to maintaining majority support for immigration.
Figure 14: Immigration ‘too high’ and unemployment rate
The recent outbreak of populism and nativism in other countries has in large part been a backlash against migration, particularly in Europe, where large inflows of refugees have severely tested popular support for immigration. Survey evidence shows people over-estimate the percentage of migrants as a share of the population by a factor of two and understate migrant quality, a sub-set of the broader tendency to over-estimate the true extent of globalisation by a factor of five.53
Australia outperforms on this measure of globalisation, with 26 per cent of the population born outside Australia based on the 2016 Census, reflecting the country’s long-standing appeal as a destination for migrants. This is only slightly higher than the 22.6 per cent share of foreign born at the time of the first Census in 1901, although the composition of the foreign born population has changed over time.54 By contrast, the foreign born population of the United States rose to a 107-year high of only 13.7 per cent in 2017, having bottomed in 1970 at only 4.7 per cent.55
At around 1 per cent of the population in the December quarter 2017, net overseas migration to Australia is not large by historical standards and only slightly above the post-war average of 0.7 per cent (Figure 15). In 1950, for example, net overseas migration to Australia was 149,507 and 1.8 per cent of the population when Australia’s housing stock and infrastructure were very limited. The permanent migration program peaked at 190,000 in 2013-14, but has since declined to 183,608 in 2016-17.56 Australia, together with the United States, the United Kingdom and Canada, is the destination for around 70 per cent of the world’s skilled migrants. The United States hosts close to half the high-skilled migrants to OECD countries, but Australia captures a significant share of the remainder.57
Figure 15: Net overseas migration as share of Australian resident population since federation (%)
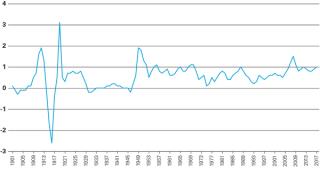
Immigration shows a pronounced cyclical pattern, with net overseas migration as a share of the population declining during economic downturns. This likely reflects a combination of an endogenous response to economic conditions and policy changes in the migration program.
Like other countries, Australia stands to gain from increasing its openness to temporary and permanent cross-border migration flows. However, 59 per cent of arrival visas are for temporary migration, with only 20 per cent for permanent migration. University students are nearly 20 per cent of temporary migration visas.58
While temporary migrants make an important contribution to the economy and society, Australia should aim to increase the share of permanent migration in net overseas migration to capture the benefits of immigration and population growth. However, greater attention to the issues of housing supply and infrastructure will also be required to maintain popular support for immigration. As Eslake notes, unlike in previous decades, housing supply since 1990 has not kept pace with population growth.59
Conclusion
Globalisation is under significant political challenge around the world. Ironically, this comes after a period since 2008 when the globalisation trend has flat-lined or even retreated along some dimensions. Public perceptions exaggerate the true extent of globalisation and these perceptions are driving some of the political backlash.
Globalisation yields significant economic and social benefits, not least lifting one billion people out of poverty over the last 25 years, but these benefits are in danger of being lost if political support for international economic and social liberalisation falters. Nowhere is this danger currently more acute than in the United States, where a dramatic inward turn threatens to send global trade into reverse, with enormous economic consequences for the rest of the world.
Based on the composite measures reviewed in this report, the globalisation trend in Australia peaked around 2010-11 coincident with the peak in the terms of trade boom and has flat-lined since. Australia is not alone in this. The financial crisis dealt a serious cyclical blow to globalisation, one that has proved remarkably persistent. It remains an open question whether the globalisation trend resumes or retreats due to growing protectionism and isolationism in the rest of the world.60
Globalisation yields significant economic and social benefits, not least lifting one billion people out of poverty over the last 25 years, but these benefits are in danger of being lost if political support for international economic and social liberalisation falters.
At the margins of policy choice, Australian public policy has become increasingly restrictive in relation to cross-border flows of goods, services, capital and labour. The use of temporary trade barriers, in particular, anti-dumping measures, has been growing. Consumption taxes have been applied to low value imports and digital goods. Increased barriers to foreign direct investment, particularly in real estate and agribusiness, have been erected, along with the imposition of foreign investment application fees. Australia’s relatively high corporate tax rate and international tax rules remain resistant to reform. Unpredictable changes to visa programs have made it more difficult for business to hire abroad. Politicians increasingly talk of restricting immigration, scapegoating foreigners for their domestic policy failures in relation to housing supply and infrastructure. Proposals to divert migrants to regional areas would only serve to reduce their productivity given that productivity and urban agglomeration go hand in hand.
While globalisation has always had its critics, some economic liberals have also effectively abandoned their support for globalisation. In 2018, Martin Wolf wrote that “the liberal international order is crumbling, in part because it does not satisfy the people of our societies”. According to Wolf, “liberalisation of trade… is no longer a high priority. Still less pressing is opening borders further to free movement of people or even maintaining free flow of global capital”.61 In another article, Wolf writes that “elites must promote a little less liberalism… and pay more tax”.62 Wolf seems to think that the best way to defend the liberal international order is to give up on further liberalisation. But this position only serves to validate globalisation’s critics. It is the loss of economic dynamism, reflected in a more subdued pace of globalisation, that inspires populist and protectionist policy responses. Wolf’s intellectual capitulation to globalisation’s critics, if operationalised as policy, would only reduce economic growth and further fuel political populism and opportunism.
Against this backdrop, it is incumbent upon policymakers to continue to put globalisation in historical and comparative perspective and to correct popular misconceptions about its magnitude and extent. Policymakers need to continue to make the case for the benefits of globalisation. The 2017 Foreign Policy White Paper stated: “the Government will be a determined advocate for an open international economy. We will stand against protectionism and promote and defend the international rules that guard against unfair trade actions and help resolve disputes.”63 To give this advocacy credibility, Australia should aim to set an example as a country that prospers because it has embraced openness and eschewed protectionism. The danger is that, for some politicians, accommodating anti-globalisation sentiment may be the path of least political resistance.
Concrete measures Australia can take to improve its openness to the rest of the world and capture the associated economic and social benefits from globalisation include the following:
- Continue to unilaterally lower tariff and non-tariff barriers with a view to eliminating barriers to trade in goods and abolish Australia’s anti-dumping system.
- Remove trade distorting subsidies and government procurement policies in line with Productivity Commission recommendations.
- Continue to pursue bilateral and plurilateral trade agreements, while working within the World Trade Organization to pursue multilateral agreements on specific issues such as digital commerce.
- Encourage the United States to re-join the Comprehensive and Progressive Agreement for Trans-Pacific Partnership (CPTPP).
- Facilitate the uptake of the provisions of free trade agreements by Australian business, particularly small-medium enterprises (SMEs).
- Lower barriers to digital commerce.
- Narrow the focus of Australia’s foreign investment screening process to national security considerations only, as recommended in our separate report, Deal-Breakers?
- Lower the corporate tax rate to 25 per cent, a rate more comparable to that of our largest investment partners, the United States and the United Kingdom, to increase foreign investment.
- Increase the size of Australia’s permanent migration program while liberalising housing supply and improving infrastructure.
- Facilitate temporary migration through a broader range of visa categories and increased visa numbers.
Deal-breakers? Regulating foreign direct investment for national security in Australia and the United States

Appendix: Australia’s free trade agreements
In force:
- Australia-New Zealand (ANZCERTA or CER) — 1 January 1983
- Singapore-Australia (SAFTA) — 28 July 2003
- Australia-United States (AUSFTA) — 1 January 2005
- Thailand-Australia (TAFTA) — 1 January 2005
- Australia-Chile (ACl-FTA) — 6 March 2009
- ASEAN-Australia-New Zealand (AANZFTA) — 1 January 2010 for eight countries: Australia, New Zealand, Brunei, Burma, Malaysia, the Philippines, Singapore and Vietnam; for Thailand: 12 March 2010; for Laos: 1 January 2011; for Cambodia: 4 January 2011; for Indonesia: 10 January 2012
- Malaysia-Australia (MAFTA) — 1 January 2013
- Korea-Australia (KAFTA) — 12 December 2014
- Japan-Australia (JAEPA) — 15 January 2015
- China-Australia (ChAFTA) — 20 December 2015
Negotiations concluded, but not in force:
- Indonesia-Australia
- Comprehensive and Progressive Agreement for Trans-Pacific Partnership (TPP-11)
- Peru-Australia
- Pacific Agreement on Closer Economic Relations — Australia, Cook Islands, New Zealand, Nauru, Kiribati, Niue, Samoa, Solomon Islands, Tonga and Tuvalu
Under negotiation:
- Australia-European Union Free Trade Agreement
- Australia-Gulf Cooperation Council (GCC) Free Trade Agreement
- Australia-Hong Kong Free Trade Agreement
- Australia-India Comprehensive Economic Cooperation Agreement
- Environmental Goods Agreement
- Pacific Alliance Free Trade Agreement
- Regional Comprehensive Economic Partnership
- Trade in Services Agreement
Prospective:
- Australia-United Kingdom Free Trade Agreement
Source: DFAT

