Executive summary
America’s influence in the Asia-Pacific and China’s continuing rise
Many countries in the Asia-Pacific region, particularly long-standing allies of the United States, such as Japan and South Korea, see American influence as strong and positive. Indonesia, Japan and South Korea consider the United States to be the most influential country in the region, while Australia and China view China as having more influence than the United States (Table 1). In every country surveyed, respondents rated the United States as having more influence on that particular country than China (Figure 4).
There is less ambiguity about China’s influence in the future however, with both Japanese and South Korean respondents predicting that China will be the most dominant country in the region ten years from now (Table 2).
Respondents across the Asia-Pacific tend to agree that we are either seeing, or have seen, the high-water mark of American power. There is a high degree of consensus that ‘American’s best days are in the past’ (61 per cent to 82 per cent among the five countries surveyed) and that China will eventually replace the United States as the world’s leading superpower (Table 3). Yet in all countries, respondents report wanting a stronger relationship with the United States, though not always as strongly as they report wanting one with China.
China’s relationship with the United States and the region
Chinese respondents express pride and optimism about China’s continued ascent, economically and politically. At the same time, there are repeated signals in the data that China wants strong, positive relations with the United States. Of the five countries surveyed, China is the most desirous of a stronger relationship with the United States (Figure 7). Chinese respondents are also the most desirous of increasing trade with the United States (Figure 8). While few Chinese describe the US-China relationship as one between ‘close friends’, about half of Chinese respondents label the relationship as ‘competitors’, and 30 per cent opt for the label ‘partners’. These are among the more positive assessments of the US-China relationship that we observe across the five countries taking part in the survey. Only 12 per cent of Chinese respondents believe that the United States would start a conflict in the Asia-Pacific region (Table 7) and 16 per cent rate a conflict between the United States and China as being ‘quite’ or ‘extremely likely’. This compares to 43 per cent with respect to a Japan-China conflict or 36 per cent with respect to conflict on the Korean peninsula (Figure 10).
Trade
It would seem that commerce — or the promise of it — transcends feelings of warmth or enmity towards either the United States or China (Figure 8). Australians and South Koreans make only small distinctions between the United States and China when asked about the desirability of increased trade with either country. Indonesians are the least desirous of increased trade with either the United States or China, with only a small preference for more trade with China. Japan is at best indifferent about increasing trade with China; one of just several ways in which Japanese public opinion is markedly different from opinions elsewhere in the region.
With the notable exception of Japan, the majority of respondents of the other four countries surveyed reported not knowing about the Trans-Pacific Partnership (TPP). When probed, no more than 46 per cent of Australian respondents could select an accurate description of the TPP (similarly, 35 per cent in South Korea and 25 per cent in China). However, 87 per cent of Japanese respondents chose the correct description of the TPP.
Japanese exceptionalism
Trade is not the only way in which Japanese respondents report a distinctly different set of attitudes. Japanese respondents report negative perceptions and assessments of China at many points in the survey, perhaps originating from longstanding suspicions of Chinese ambition, and possibly exacerbated by ongoing tensions regarding the status of the Senkaku/Diaoyu islands and the standoff in the East China Sea. Negative assessments of China’s influence on the Asia-Pacific outweigh positive assessments by 60 percentage points in Japan; the next most negative set of assessments comes from Australians, with negative assessments outweighing positive assessments by six points (Figure 3).
Japanese respondents also overwhelmingly think that China has a negative influence on their country, with negative perceptions outweighing positive perceptions by 58 percentage points. Australians again have the second most negative views about China’s influence on their country, with positive perceptions outpacing negative perceptions by 20 points, highlighting the exceptionally negative views of China among Japanese respondents (Figure 6). With the exception of North Korea, Japanese and Chinese respondents believe that the other country was the most likely to start a conflict in the Asia-Pacific region — 37 per cent and 56 per cent respectively (Table 7). Nonetheless, Japanese respondents do not believe that a serious military conflict between China and Japan is especially likely; only eight per cent of Japanese respondents rate a conflict with China as ‘very’ or ‘extremely’ likely (Figure 10).
Australian ambivalence
Though bound by treaty and general affinity to the United States, Australian respondents (a) generally report similar assessments of both the United States and China in many respects; (b) accept Chinese dominance in the region as a reality today; (c) sense competitive tension in the US-China relationship, but (d) attach little probability to that tension generating a militarised conflict.
Among the five countries surveyed, Australians are most likely to report that China has the most influence in Asia today (69 per cent); however, negative appraisals of China’s influence in the Asia-Pacific outpace positive appraisals by seven percentage points (indistinguishable from the same net rating given to the United States). Very little distinguishes Australian assessments of the influence of the United States and China on Australia (Figures 5 and 6), or a desire for more trade with either country (Figure 8). One of the few points of difference is that Australians are considerably more likely to report wanting a stronger relationship with China than the United States (Figure 7).
Australians are the most likely to use the term ‘competitors’ to describe the relationship between the United States and China (70 per cent) and the least likely to use the label ‘partners’ (9 per cent; Table 5). Australians do not see an interstate conflict in the AsiaPacific as particularly likely, but are slightly more likely to report that China might initiate such a conflict (17 per cent) than the United States (10 per cent).
Australia’s relative distance from China — coupled with the fact that China is Australia’s largest trading partner — sees Australia perhaps less anguished by China’s rise, and Australian respondents less willing to express a strong preference for continued strong ties with the United States. This contrasts with the views of Japanese respondents and (to a lesser extent) South Korean respondents.
Ethnocentrism, nationalism and anti‑Americanism in the Asia‑Pacific
The survey asked respondents to rate different nationalities (including their own) on a variety of dimensions. Comparisons of in-group and out-group average ratings (or stereotypes) permit assessments of nationalist or ethnocentric prejudice over various outgroups. Highlights of this analysis include:
- the tendency of Japanese respondents to ascribe negative attributes to Chinese people such as ‘rude’ and ‘violent’; the most negative stereotypes observed across all five countries
- conversely, Japanese respondents report much more favourable stereotypes of Americans than of Chinese people
- four out of five countries consistently rate Americans as more ‘violent’ than ‘peaceful’, with only South Koreans giving Americans a neutral rating on this dimension
- Australians give slightly more negative ratings of Americans than they give to Chinese people, and provide the most consistently negative stereotypes of Americans relative to stereotypes of Chinese of any country in the data, other than China itself.
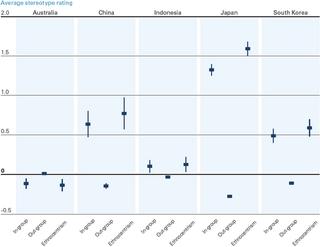
With these ratings, we define ethnocentrism as the difference between average in-group and average outgroup ratings (Figure 14). By this measure, Japanese respondents provide the most ethnocentric set of responses of the five countries surveyed, driven largely by negative stereotypes of Chinese people. Japanese respondents also report the most positive in-group evaluations (by a wide margin). Chinese respondents rank second in ethnocentrism, followed by South Korea and Indonesia. Australians record small negative levels of ethnocentrism, tending to rate outgroups more strongly than they rate themselves. The reluctance of Australians to report positive stereotypes about themselves relative to other groups in the Asia-Pacific might reflect Australian insecurity about its role and competitiveness in the region (for example, Australians rate themselves especially poorly on the ‘lazy’ to ‘hardworking’ dimension).
The United States in the Asia-Pacific
The United States and China: influence and evaluations in the Asia-Pacific
The United States is considered the most influential country in Asia in three of the five countries covered by the survey (Indonesia, Japan and South Korea; Table 1). Australia and China rate China’s influence above that of the United States. In fact, Australian respondents were the most likely to nominate China as the country with the most influence in Asia (69 per cent), outpacing the rate at which even Chinese respondents nominated their own country (56 per cent).
Table 1: “Which country has the most influence in Asia today?”

South Korean respondents were the most likely to nominate the United States as the country with the most influence in Asia. Forty per cent of Chinese respondents also nominate the United States as the most important country in the region. But, just 22 per cent of Australian respondents rated the United States as the country with the most influence in Asia, the lowest percentage among the five countries in this analysis.
When respondents are asked about the future — which country will have the most influence in Asia in ten years from now — mixed results emerge (Table 2). Overwhelming majorities of respondents in three out of five countries are most likely to nominate China as the most influential country in Asia in the near future, the exceptions being Indonesia and Japan.
Table 2: “Which country will have the most influence in Asia in ten years?”

Seventy-seven percent of Chinese respondents nominate China as the most influential country in Asia ten years from now; unsurprisingly, Chinese respondents are more optimistic about China’s future influence in Asia than any other set of respondents. South Korea and Australia are the next most sanguine about China’s influence in the future, with two-thirds nominating China as the most influential country in Asia ten years from now. The proportion of Australian respondents nominating China actually falls somewhat to 64 per cent, still a clear majority, but with 13 per cent of Australian respondents nominating India as the most influential country in Asia in ten years’ time.
The responses from Japan and Indonesia differ markedly from the other countries in the analysis. Just 22 per cent of Indonesian respondents see China as the most influential country in Asia today; this proportion rises to just 29 per cent when we ask about influence in Asia ten years from now. Roughly one quarter of Indonesian respondents nominate Japan as the country with the most influence in Asia both now and in ten years’ time. Japanese opinion is perhaps the most fractured on these questions, across the five countries in the study. Asked about influence in Asia today, Japanese respondents break 48/39/11 USA/ China/Japan; this becomes a 28/34/13 split when Japanese respondents are asked to look ten years into the future. Japanese respondents are also bullish on India’s prospects over the next ten years: 20 per cent see India as having the most influence in Asia ten years from now, the highest level among the five countries in the analysis.
Change in influence over the next ten years
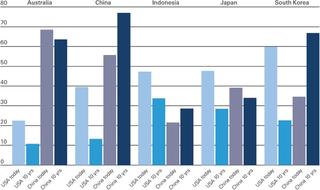
Across the five countries in the analysis, there is a consensus about the relative influence of the United States diminishing over the next years across all five countries. Figure 1 compares the rates at which respondents nominate the United States or China as the most influential country in Asia now and ten years from now, across the countries in the analysis. In every country, respondents expect to see American influence diminish in the Asia-Pacific over the decade to come.
In every country, respondents expect to see American influence diminish in the Asia-Pacific over the decade to come.
The drop in the percentages nominating the United States as the most influential country in Asia (today versus ten years from now) is largely related to baseline levels: only 22 per cent of Australians believe the United States to be Asia’s most influential country today and the fall among Australian respondents is just 11 percentage points (left-hand column of Figure 1). South Korea sees a large fall of 37 percentage points, but starts from a much higher baseline, with six out of ten South Korean respondents nominating the United States as the most influential country in Asia today.
There is less crossnational consensus about the rise of China’s influence. Australian respondents are the most likely to report that China is the most influential country in Asia today, a position that is largely unchanged when we ask respondents to look ten years ahead. South Korean respondents foresee a large increase in China’s influence over the next ten years, as do Chinese respondents. But Indonesian and Japanese opinions as to which country has — or will have — the most influence in Asia are less one-sided, and less clear on the question of a rise in China’s influence in the region.
Figure 1: Influence of the United States and China in Asia, now and ten years from now, by country of respondent
The United States and China as superpowers
We see a similar pattern of cross-country variation when we ask respondents about the United States and China as superpowers. Respondents were asked if China has already/will eventually/will never replace the United States as the world’s leading superpower. Table 3 summarises the responses.
Table 3: The United States and China as the world’s leading superpower
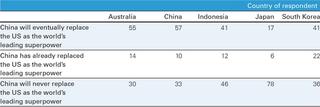
Reasonably slim majorities of both Australian and Chinese respondents state that China will eventually replace the United States as the world’s leading superpower; the degree of similarity between Australian and Chinese respondents on this score is striking, with a virtually identical distribution of results in both countries. Relatively few Australians or Chinese respondents report that China has already become the world’s leading superpower, although the proportion of Australian respondents with this view is marginally greater than the proportion of Chinese respondents holding this view (14 per cent to 10 per cent).
Indonesian public opinion is rather evenly split on this question, while more than one in five South Koreans report that China has already become the world’s leading superpower. Japanese respondents are once again distinctively pro-American in their views comparing the United States and China: only 17 per cent report that China will eventually replace the United States as the world’s leading superpower and an overwhelming 78 per cent say that China will never replace the United States as the world’s leading superpower.
A belief that the United States’ best years are in the past is associated with the belief that China will eventually replace the United States as the world’s leading superpower
A similar item asked respondents if the United States’ ‘best years’ lay in the past or in the future. Majorities in every country report that the United States’ best years are in the past, ranging from 82 per cent in China, 80 per cent in Australia and South Korea, to 68 per cent and 61 per cent in Indonesia and Japan, respectively.
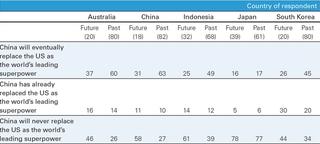
A belief that the United States’ best years are in the past is associated with the belief that China will eventually replace the United States as the world’s leading superpower (Table 4). Respondents reporting that America’s best days have passed are almost twice more likely to say that China will become the world’s leading superpower than the minority of respondents reporting that America’s best days lie ahead.
The converse pattern holds when we examine the percentage of respondents saying that China will never replace the United States as the world’s leading superpower (Table 4). The exception is Japan, where beliefs about China’s superpower status are unrelated to beliefs about American decline: even among the 39 per cent of Japanese respondents who report that America’s best years are in the past, 78 per cent contend that China will never replace the United States as the world’s leading superpower. Japan aside, beliefs about America’s decline and China’s rise as a superpower are clearly linked.
Table 4: The United States and China as the world’s leading superpower, by belief about the United States’ best days lying in the future or in the past, by country
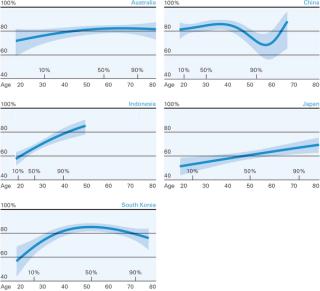
Are younger respondents more likely to see the United States’ best days as ‘in the past’? The relationship between a belief that the United States’ best days are in the past and age is uneven across the five countries surveyed (Figure 2). There is almost no variation by age in a belief in American decline both in Australia and China (the fitted lines in the top two panels of Figure 2 are virtually horizontal). Younger Indonesians, Japanese and South Koreans are less likely to report that the United States’ best days are behind it than their older compatriots. Older South Koreans are also less likely to report a belief in American decline. Nonetheless, across all age groups — and across all countries surveyed here — majorities accept the proposition that the United States’ best days are in the past.
Figure 2: Percentage of respondents saying that the United States’ best days are ‘in the past’, by age, by country. A smoothing spline is fit to the data for each country; shaded areas indicate pointwise 95 per cent confidence intervals; ticks indicate 10th, 50th (median) and 90th percentiles of the age distribution within each country.
Helping or harming the region?
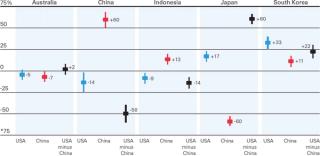
A variety of survey questions addressed the concept of ‘influence’ on the region. For instance, respondents were asked if the United States and China do more good or more harm in the Asia-Pacific region. For each country, we compute the net percentage of respondents reporting ‘doing good’ versus ‘doing harm’ for both the United States and China and the USA-China difference. The results are displayed in Figure 3.
Sentiment about the relative benefits to the region from the United States and China are quite varied. Chinese respondents are unsurprisingly overwhelmingly positive about their country’s contribution to the AsiaPacific (net positive/negative score of 60). South Korea, Indonesia and Australia record much more balanced assessments of China’s impact, with scores of 11, 13 and -7, respectively. Japanese respondents hold overwhelmingly negative views about China’s impact on the region, with a net positive/negative score of -60. Sentiment towards the impact of the United States on the region is less varied across the five countries in the survey. Net positive/negative scores range from a low of -14 (China) to a high of 33 (South Korea).
Japan and China are the most polarised countries in terms of differences in sentiment towards the United States and China. Japanese respondents recorded a 76 point net favourability of the United States’ impact on the Asia-Pacific over China; Chinese respondents hold much more favourable impressions of their own country’s contribution to the region than that of the United States (a 73 point difference in net favourability). South Koreans record 22 points net favourability towards the United States over China. Australian respondents record the most neutral assessments among the five countries in this analysis: Australians report small, negative assessments of the contributions of both the United States and China on the Asia-Pacific that are statistically indistinguishable from one another.
Figure 3: Net percentage of respondents reporting the United States (blue) or China (red) as helping (positive) or harming (negative) the Asia-Pacific region, by country of respondent. Black bars show percentages of respondents giving the United States more favourable ratings than China. Vertical bars cover 95 per cent credible intervals.
The United States and China: friends or foes?
Respondents in each country were also asked to describe the relationship between the United States and China, selecting a word or phrase that best describes the relationship from a list of five possibilities (Table 5).
Table 5: “Which word best describes the relationship between China and the United States?”

Few respondents in any country describe the United States and China as ‘close friends’. With the exception of Japanese respondents, similarly small proportions of respondents describe the United States and China as ‘enemies’; 15 per cent of Japanese respondents select this description. The label ‘competitors’ is overwhelmingly the most preferred choice of Australian respondents (70 per cent), and majorities of respondents in China (52 per cent) and South Korea (54 per cent) also select this term, and this is also the modal response in Indonesia (48 per cent). ‘Fearful’ is the modal response among Japanese respondents (34 per cent); Japanese respondents were at least twice more likely to select this label than respondents in other country.
Negatively toned labels (‘fearful’ and ‘enemies’) are selected more frequently than positively toned labels (‘close friends’ and ‘partners’) in Australia (19 per cent versus 11 per cent) and Japan (49 per cent versus 26 per cent). South Korean responses tend very slightly towards the positive over negative (26 per cent versus 21 per cent). Indonesian respondents have a more benign view of the US-China relationship than even Chinese respondents. Forty-two per cent of Indonesian respondents select the two positively valenced labels, outpacing the 34 per cent of Chinese respondents describing the two countries as ‘close friends’ or ‘partners’.
The influence of the United States and China on specific countries
Respondents evaluated the extent of influence of both the United States and China on their specific countries using a five point rating scale ranging from ‘none at all’ to ‘a great deal’. These questions were not asked of Chinese respondents.
Figure 4: Percentage of respondents reporting that the United States (blue) and China (red) have ‘a great deal’ or ‘a lot’ of influence on their country. Black bars shows the difference between the United States and China percentages. Vertical bars cover 95 per cent confidence intervals. These questions were not asked of Chinese respondents.
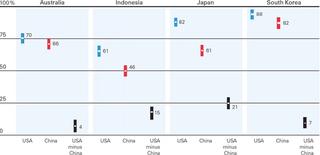
Both the United States and China are generally considered to have high levels of influence on each of the four countries where we administered this question. With one exception, majorities of respondents in four countries report that both the United States and China have ‘a great deal’ or ‘a lot’ of influence on their respective countries. The exception is the 46 per cent of Indonesians who report that China has ‘a great deal’ or ‘a lot’ of influence on Indonesia.
The United States is consistently and unambiguously perceived as having more influence than China on Australia, Indonesia, Japan and South Korea. This difference in perceived influence (rating of US influence minus ratings of China’s influence) is small in Australia and South Korea (+4 and +7, respectively), but large in Indonesia and Japan (+15 and +21, respectively). Overwhelming majorities of South Korean respondents see both the United States and China as having ‘a great deal’ or ‘a lot’ of influence on South Korea (88 per cent and 82 per cent, respectively). Japan attaches comparable ratings to the influence of the United States (82 per cent). Australian ratings are less overwhelming (70 per cent and 66 per cent), with Indonesian respondents ratings of American and Chinese influence the lowest of the set.
We stress against over-interpreting these crossnational differences; translation of the question and the response options could well explain some of the results. But nonetheless, we see a repetition of crossnational patterns in the survey responses. South Korea and Japan report high levels of engagement and attachment to the United States, with Japanese respondents far more favourably disposed towards the United States than China. Australian respondents report less engagement with either the United States or China than Japan and South Korea. Indonesian respondents report the lowest levels of engagement with either the United States or China among the countries spanned by the survey.
Figure 5: Percentage of respondents reporting that the United States (light blue) and China (dark blue) have ‘a great deal’ or ‘a lot’ of influence on their respective country, by age, by country. A smoothing spline is fit to the data for each country; shaded areas indicate pointwise 95 per cent confidence intervals; ticks indicate 10th, 50th (median) and 90th percentiles of the age distribution within each country.
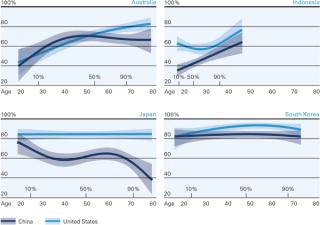
Within each country, perceptions of the influence of the United States and China exhibit some interesting variation with age (Figure 5). In Australia, there is a clear relationship between age and seeing the United States and China as especially influential. Roughly 70 to 80 per cent of Australians aged 60 and older see the United States as having ‘a great deal’ or ‘a lot’ of influence on Australia; this percentage declines among younger cohorts, attaining 50 per cent for the youngest respondents in the Australian data. Australian respondents under the age of 40 are also slightly less likely than older respondents to report that China has ‘a great deal’ or ‘a lot’ of influence on Australia. That is, younger Australians see less influence from both the United States and China than is reported by older generations of Australians. Similar patterns are apparent in Indonesia, with an upward trend over age cohorts in the perceived influence of both the United States and China.
Japanese views of the influence of China and the United States diverge across age cohorts. Among the youngest Japanese respondents, both China and the United States are seen as having considerable influence on Japan: more than 80 per cent of young Japanese respondents report that the United States has ‘a great deal’ or ‘a lot’ of influence on Japan, and a statistically indistinguishable percentage make the same assessment about the influence of China on Japan. Assessment of the influence of the United States on Japan do not vary with age in the Japanese data, but assessments of the influence of China on Japan fall among older Japanese respondents, especially among the most elderly Japanese respondents.
In South Korea, assessments of the influence of the United States and China are high among all age cohorts, with at least 80 per cent reporting that both countries have ‘a great deal’ or ‘a lot’ of influence on South Korea. There is no discernible distinction between assessment of American or Chinese influence among the youngest South Korean respondents, nor the oldest; assessments that the United States exerts more influence on South Korea than does China are concentrated among South Koreans aged 40 to 70, with roughly 90 per cent of these respondents reporting that the United States has ‘a great deal’ or ‘a lot’ of influence on South Korea. Opinions about the influence of China on South Korea do not vary over age cohorts.
Respondents were also asked whether the United States and China have a positive or negative influence on their respective countries (Figure 6). Japanese respondents are alone in reporting net negative evaluations of China’s influence (net favourability of -58); Australian, Indonesian and South Korean respondents report net positive evaluations of China’s influence on their respective countries.
Figure 6: Net percentage of respondents reporting United States (blue) or China (red) as having a positive or negative influence on the country of the respondent. The black squares show the percentage of respondents whose assessment of the influence of the United States on their country is more positive than their assessment of the influence of China, less the percentage of respondents with the contrary view. Vertical bars cover 95 per cent credible intervals.
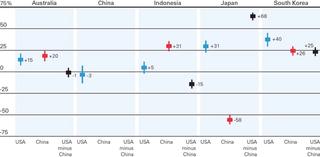
The United States is rated positively on this dimension in four out of the five countries in the analysis, with the exception of China (net rating of -3, but statistically indistinguishable from zero). South Korea’s evaluation of the influence of the United States is the highest net rating in the data (+40), followed by Japan’s rating of American influence on Japan (+31) and Indonesia’s rating of Chinese influence on Indonesia (+31). Australian respondents again report similar, net positive evaluations of the influence of the United States and China on Australia (+15 and +20, respectively), with no statistically meaningful difference between the two.
Stronger or weaker relationships with the United States and China?
In almost every instance, respondents across the five countries report wanting stronger relationships with both the United States and China. Figure 7 shows the net stronger/weaker percentages in each country, with reference to both the United States and China, and the difference between the two. Chinese respondents have the highest net stronger score among the five countries surveyed (+48), outpacing Korea (+43) and Japan (+29). Australian public opinion is much more divided on the question of stronger or weaker ties with the United States; the net stronger/weaker score for Australia is +4 but not statistically distinguishable from zero.
Figure 7: Net percentage of respondents reporting wanting a stronger (positive) or weaker (negative) relationship between their country and the United States (blue) or China (red), by country of the respondent. The black square shows the percentage of respondents preferring a stronger relationship with the United States than with China, minus the percentages of respondents with the contrary view. Vertical bars cover 95 per cent credible intervals.
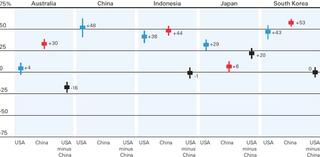
The desire for stronger relationships with China exceeds the desire for stronger relationships with the United States in South Korea (10 points), Indonesia (6 points) and especially in Australia (26 points). Japan again is the outlier here, with a barely positive net stronger/weaker score with respect to Japan’s relationship with China (+6), but an unambiguous +29 on a stronger relationship with the United States. Japan’s pro-USA differential of 20 points is the only instance where we see public opinion more in favour of stronger ties with the United States than with China.
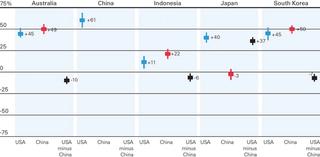
Figure 8: Net percentage of respondents reporting wanting more (positive) or less (negative) trade with the United States (blue) or China (red), by country of the respondent. The black square shows the percentages of respondents preferring more trade with the United States than more trade with China, minus the percentage of respondents with the contrary view. Vertical bars cover 95 per cent credible intervals.
The specific case of trade
A similar pattern is apparent when respondents are asked about more or less trade with the United States and China (Figure 8). Few respondents report favouring less trade with either country; the exception is Japan, where respondents are indifferent between more or less trade with China. By a margin of 61 percentage points, Chinese respondents seek more trade rather than less trade with the United States, the highest such percentage among the five countries covered by the survey. Indonesian respondents are the least desirous of increased trade with either the United States or China. In the aggregate, Australian respondents are indifferent between increasing trade with the United States or increasing trade with China.
Polarisation in attitudes towards the United States and China
The analysis reported in the preceding sections relies on aggregate, country-by-country summaries of the data. Here we investigate the data at the individual level, examining the extent to which individuals hold opposing views about the United States and China. Does holding favourable attitudes towards the United States imply that an individual holds negative attitudes towards China, or vice-versa?
Figure 9: Distribution of differences in individual responses on pairs of survey items asking about the United States and China, by item (rows) and by country (columns). The grey bar indicates respondents who give identical responses with respect to the United States and China. The standard deviation of the differences is superimposed on each panel, along with the percentage of respondents whose responses with respect to the United States and China differ by two or more points on the five or seven point ratings scales used with these questions.
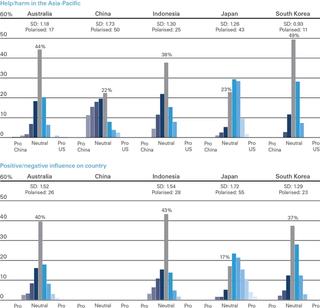
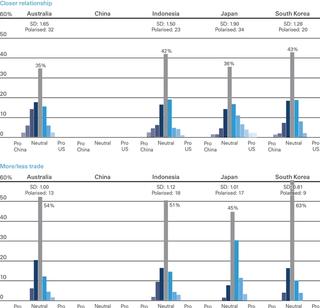
Figure 9 summarises the way individuals give different responses across pairs of items that refer to the United States and China. The items summarised are: (a) does the US/China help or harm the Asia-Pacific region; (b) does the US/China have a positive/negative influence on the respondent’s country; (c) should the respondent’s country have a closer relationship with the US/China, and (d) should the respondent’s country have more/less trade with the US/China. For each individual we compute the response with respect to the United States minus the response with respect to China, such that positive difference scores indicate a more favourable response with respect to the United States vis-a-vis China, and conversely for negative scores. Large variation in the difference scores would indicate polarisation in views about the United States and China; ie, there are relatively many respondents holding either pro-US and negative views towards China, or the converse. A summary of the variation of these US/China differences — the standard deviation — is presented on each panel of Figure 9. The grey vertical bar represents the proportion of respondents who give the same response when asked about the United States or China on a particular pair of items, rating the two countries equally. Note that not all of these items were fielded to Chinese respondents (e.g. questions about increased trade with China); difference scores are unavailable for Chinese respondents in these cases.
Finally, another measure of difference in the responses is shown in Figure 9: the percentage of respondents whose responses differ by two or more points (on the five and seven point rating scales utilised for these questions) in their answers about the United States and China. We define respondents with this level of dissimilarity in their responses as holding ‘polarised’ views towards the United States and China.
The Australian population splits into three roughly equal sized groups: those with a mild to moderate preference for closer relations with China over the United States, a group with similarly mild to moderate preferences for closer relations with the United States over China, and a group that is largely indifferent between the two.
The question of more or less trade with the United States or China produces relatively high levels of consensus. This item produces the highest level of ‘neutral’ responses and small levels of polarisation, with roughly half of respondents in each country not discriminating between trade with the United States or China; Japan is again a slight exception to this pattern.
Unsurprisingly, we observe relatively high levels of polarisation when Chinese respondents are asked about the United States and China harming or helping the Asia-Pacific (sd = 1.73, polarisation = 50 per cent). Comparable levels of polariation are observed when we ask Japanese respondents about the influence of the United States and China on Japan; just 17 per cent of respondents offer neutral assessments and the polarisation level is 55 per cent. Japanese respondents also present some of the lowest levels of neutrality and the highest levels of polarisation with respect to other survey items presented in Figure 9.
Moderate levels of polarisation are apparent when Australians are asked about closer relationships with the United States and China. Just 35 per cent of Australians give the same response across the pair of survey items, and one-third give responses that differ by at least two points, far ahead of the 20 per cent and 23 per cent polarisation rates in Indonesia and South Korea on this item, and rivalling the 36 per cent rate of polarisation generated by Japanese respondents. The Japanese responses are not so much polarised as they are marked by a pronounced preference for closer relations with the United States over China; in the case of the Australian responses, the lack of balance in the responses with respect to the United States and China is much more symmetric than in Japan. Roughly speaking, the Australian population splits into three roughly equal sized groups: those with a mild to moderate preference for closer relations with China over the United States, a group with similarly mild to moderate preferences for closer relations with the United States over China, and a group that is largely indifferent between the two.
American ‘soft power’: university study in the United States
Institutions of higher learning are widely recognised as critical components of a country’s ‘soft power’. This is perhaps especially true for the United States. We assessed the desirability of an American university education via a survey question that posed a choice between attending an American university and a domestic university, with cost assumed to be neutral. The text of the question appears in Table 6, along with the distribution of responses by country.
Table 6: “Suppose a young [Australian/Chinese/etc] person is choosing between studying at a university in the United States or at a university here in [Australia/China/etc], and the cost of the two universities was about the same. Should this person choose the university in the United States, or the university here?”
![Suppose a young [Australian/Chinese/etc] person is choosing between studying at a university in the United States or at a university here in [Australia/China/etc], and the cost of the two universities was about the same. Should this person choose the university in the United States, or the university here?](https://cdn.sanity.io/images/ooh1fq7e/production/1e9c3ce43a4bb629cbd3fff2d40ea0ca0b594ae5-1351x544.jpg/ARN%20table%206.jpg?rect=2,0,1349,544&w=320&h=129&auto=format)
In every country except Australia, there is a clear preference for a university education in the United States over attending university in the respondent’s home country. South Korea is the most bullish on an American university education, with 67 per cent of respondents reporting that given a cost-neutral choice between an American or South Korean university, a young South Korean should ‘definitely’ or ‘probably’ choose the university in the United States. The corresponding percentages are 61 per cent in Indonesia, 57 per cent in China, 36 per cent in Japan, but just 16 per cent in Australia. Sixty per cent of Australian respondents said that a young Australian should ‘definitely’ or ‘probably’ choose the university in Australia, given a cost-neutral choice between an American or Australian university; the corresponding figures in the other countries surveyed are 22 per cent for China, 24 per cent for Indonesia, 22 per cent for Japan and only 10 per cent for South Korea.
For the most part, American universities continue to hold considerable sway in the Asia-Pacific, among allies and non-allies of the United States. The striking exception is Australia, with preferences almost completely at odds with those of the other countries in the survey. The preference for American over domestic universities is less pronounced in Japan, with 43 per cent of respondents being indifferent between the American or Japanese universities (the highest level of indifference in the five countries surveyed), and American universities preferred by a margin of 36 per cent to 22 per cent.
The possibility of interstate conflict
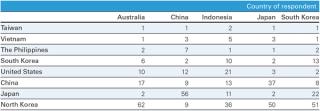
Respondents were asked about the prospects of interstate conflict. Table 7 presents a summary of opinion as to which country or region is likely to start a conflict in the Asia-Pacific region in the next ten years. North Korea is seen as the most likely source of conflict in the Asia-Pacific in all countries except China, where 56 per cent report that Japan is most likely to be the instigator of conflict. Only nine per cent of Chinese respondents report that North Korea will initiate conflict, the same proportion of Chinese respondents reporting that China itself will be the instigator of conflict in the Asia-Pacific.
After North Korea, Japan is generally seen as the country most likely to initiate conflict in the Asia‑Pacific, driven largely by the facts that (a) 56 per cent of Chinese respondents select Japan in response to this question; (b) 22 per cent of South Koreans also select Japan. Just 2 per cent of Australians select Japan as the most likely to start a conflict in the Asia-Pacific, the same proportion as in Japan itself. More than one third of Japanese respondents (37 per cent) think China is most likely to initiate conflict, a proportion that falls to 17 per cent among Australians and lower elsewhere.
The United States is generally thought to be unlikely to initiate conflict in the Asia-Pacific. Indonesians attach the highest likelihood to the United States initiating conflict in the region: 21 per cent of Indonesians nominate the United States, second only to North Korea (36 per cent) in the Indonesian data. Twelve per cent of Chinese respondents select the United States as the most likely to start conflict in the Asia-Pacific, second only to Japan (56 per cent). Australian respondents are more likely to report that China will start a conflict in the Asia-Pacific than the United States, 17 per cent to 10 per cent. Negligible proportions of Japanese and South Korean respondents report the United States as the most likely progenitor of conflict in the Asia-Pacific, three per cent and two per cent, respectively.
Table 7: “Over the next ten years, which of the following is the most likely to start a conflict in the Asia-Pacific region?”
The likelihood of specific interstate conflicts
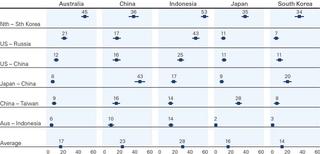
Respondents were asked about the likelihood of six specific conflicts: (1) between North and South Korea; (2) Japan and China; (3) the United States and Russia; (4) China and Taiwan; (5) the United States and China; (6) Australia and Indonesia. Figure 10 presents the percentage in each country selecting the ‘very likely’ or ‘extremely likely’ response option.
The possibility of conflict on the Korean peninsula tends to dominate the responses in all countries except China, where Japan-China conflict is seen as marginally more likely. More than half of Indonesian respondents think conflict on the Korean peninsula is ‘very likely’ or ‘extremely likely’; almost half of Australian respondents (45 per cent) also report this view, along with a third of South Korean respondents (34 per cent).
While 43 per cent of Chinese respondents rate conflict with Japan as ‘very likely’ or ‘extremely likely’, the corresponding figure among Japanese respondents is just nine per cent. Twenty per cent of South Korean respondents rate a Japan-China conflict as ‘very’ or ‘extremely likely’.
A conflict between the United States and Russia is seen as more likely than a US-China conflict by Australians (21 per cent versus 12 per cent reporting each respective potential conflict as ‘very likely’ or ‘extremely likely’). Virtually identical percentages of Chinese respondents report conflict between the United States and Russia (17 per cent), the United States and China (16 per cent) and China and Taiwan (16 per cent) as ‘very likely’ or ‘extremely likely’. Of the six possible conflicts presented to respondents, the likelihood of a US-China conflict typically rates third (or equal third) in each country.
While 43 per cent of Chinese respondents rate conflict with Japan as ‘very likely’ or ‘extremely likely’, the corresponding figure among Japanese respondents is just nine per cent.
Australians rate the likelihood of a conflict with Indonesia as the lowest of the six presented to them; just 6 per cent of Australians rate conflict with Indonesia as ‘very’ or ‘extremely likely’. On the other hand, 14 per cent of Indonesians assign the same likelihood to conflict with Australia, the highest likelihood for this particular interstate conflict across the five countries in the survey.
A conflict between China and Taiwan is not seen as especially likely across almost all surveyed countries, with the exception of Japan, where one in three respondents report that this conflict is ‘very’ or ‘extremely likely’.
Finally, there is substantial evidence of variation across countries in reported likelihood of conflict, irrespective of the particular hypothetical conflict being presented to respondents. For instance, averaged over the six hypothetical interstate conflicts employed here, Indonesian respondents average a 28 per cent rate of reporting conflict as ‘very likely’ or ‘extremely likely’, the highest in the set of countries we surveyed. The corresponding rate among South Korean respondents is 14 per cent, the lowest rate observed here; Australia is in the middle of the pack, with an average of 17 per cent of respondents reporting conflict as ‘very’ or ‘extremely likely’ over the six hypothetical conflicts.
Of course, these differences in country-average rates could be due to differences in way that the response outcomes are translated, or anything specific to a country and its culture or language that results in respondents being more or less likely to report extreme beliefs or to attach extreme likelihoods to hypothetical events. Note that these country-specific factors speak only to being somewhat cautious when making crossnational comparisons; within-country comparisons are unaffected. It is also unlikely that some of the more striking asymmetries in these data are artefacts of translation or country-specific response-set (e.g. Chinese versus Japanese assessments of the likelihood of a conflict between those two countries or of a conflict between China and Taiwan).
Figure 10: Percentage of respondents saying conflict between the two countries/regions in each row is ‘quite likely’ or ‘extremely likely’, by country. Horizontal lines indicate 95 per cent confidence intervals.
The Trans-Pacific Partnership
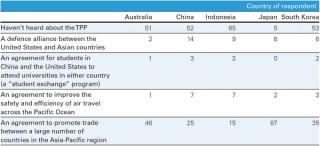
Two questions assessed knowledge of the Trans- Pacific Partnership (TPP). First, respondents were asked if they had heard of the TPP. Respondents answering affirmatively were then presented with four possible descriptions of the TPP (one correct, three incorrect) and asked to select the correct description. The results from these two questions are combined for presentation in Table 8.
Japanese respondents are overwhelmingly the most knowledgeable with respect to the Trans- Pacific Partnership. Only five per cent of Japanese respondents report not having heard about the TPP and almost all Japanese respondents (87 per cent) choose the correct description of the TPP. Roughly half of Australian, Chinese and South Korean respondents concede not having heard of the TPP; this rate is 65 per cent in Indonesia. Forty-five per cent of Australian respondents have heard of the TPP and choose the correct description of the TPP, the highest rate outside of Japan; the corresponding rates are 35 per cent in South Korea and just 15 per cent in Indonesia (note that Indonesia is not a party to the TPP). China is not a party to the TPP either and just 25 per cent of Chinese respondents report hearing of the TPP and choosing the correct description of the TPP.
Table 8: Knowledge of the Trans-Pacific Partnership (TPP), by country. Respondents were first asked: “There has been some talk lately about the Trans-Pacific Partnership. Have you heard about the Trans-Pacific Partnership?” Respondents answering affirmatively were then asked to select the best description of the TPP from the list of alternatives shown in the table.
Stereotypes of nationalities
We examined the extent to which our respondents report positive or negative stereotypes of six nationalities: the five spanned by the surveys themselves (Australia, China, Indonesia, Japan and South Korea) plus ’Americans’. Respondents were asked to assign scores on a seven point rating scale for each nationality, on four dimensions: (1) hardworking to lazy; (2) intelligent to unintelligent; (3) rude to polite; (4) violent to peaceful.1
Respondents almost always rate their ‘in-group’ more favourably than ‘out-groups’. Depending on the context, the groups in question can be defined by nationality (as is the case here), race and ethnicity, religion, class, and so on. Prejudice against out-groups can be assessed by comparing average ratings for ingroups against out‑groups.
Figure 11 presents average ratings of the five target nationalities by country of respondent (columns) and traits (rows). Favourable, stereotypical assessments of in-groups appear throughout Figure 11; orange coloured bars indicate where respondents are assessing their own nationality (the in-group), and almost all of these in-group assessments are positive. The magnitude of these in-group to out-group differences might be used as a measure of ethno-centrism or nationalism; we revisit this on page 31.
Dominating the results in Figure 11 is a by-now familiar pattern: Japanese respondents ascribe negative stereotypes to the Chinese more than any other group in these data. The most negative stereotype in the entire set of 6Å~4Å~5=120 stereotypes is the Japanese assessment of Chinese on the ‘rude’ to ‘polite’ dimension, followed by Japanese ratings of the Chinese on the ‘violent’ to ‘peaceful’ dimension. Conversely, Japanese respondents’ ratings of themselves on these same two dimensions are the most positive in the entire set of 120 stereotypical ratings.
Indonesians are uniformly ascribed lower levels of intelligence than other nationalities, even by Indonesians themselves. Indonesians are also regarded as more lazy and less hardworking than other nationalities, again, even by Indonesians themselves. Australians too, are generally rated as marginally less hard-working than other groups, especially by Australians themselves. Conversely, Japan is considered the most hardworking and least lazy country in the set, receiving positive, average ratings on this dimension in all surveyed countries. Respondents in all countries tend to rate the Japanese positively with respect to ‘intelligence’. Only Chinese and South Korean respondents rate the Japanese as less intelligent than themselves, on average. Stereotypically, Japanese people are also regarded as more polite than rude by all countries except China; nonetheless, Chinese respondents still offer neutral ratings of the Japanese on this dimension. Americans are consistently rated as more violent than peaceful in four out of five countries, with only South Koreans giving Americans a neutral, average stereotypical rating on this dimension.
Americans are seen as the most violent of the six nationalities by Australians and Indonesians. Chinese respondents rate Japanese as more stereotypically violent than Americans. Japanese respondents rate Chinese and South Koreans as more violent than Americans. Australians are generally perceived as more peaceful than violent by all surveyed countries, with the exception of Indonesia; Australians reciprocate, among the five countries surveyed here in assigning more ‘violent’ than ‘peaceful’ stereotypes to Indonesians. Americans are also perceived as more rude than polite in three out of five countries: Australia, China and Indonesia.
Figure 11: Average ratings of the five target nationalities by country of respondent (columns) and traits (rows). Lines extend from a neutral, zero average rating to each average rating; points to the left indicate negative stereotypes; points to the right indicate positive stereotypes. Colour indicates if the target nationality is an in-group (the same nationality as the respondents), or an out-group, with distinct colours used for ‘Americans’ and ‘Chinese’.
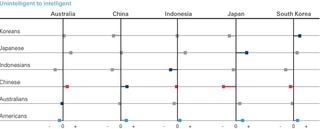
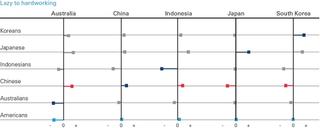
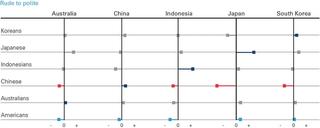
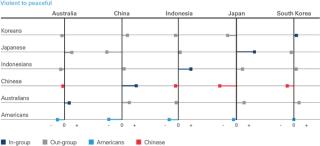
Figure 12 shows differences between ratings of Americans, Chinese and in-groups by country of respondent and across the four dimensions of evaluation. Japanese and South Koreans always rate Americans more favourably than Chinese on all four dimensions, but never give Americans higher ratings than they give to themselves. Australians never rate Americans more favourably than the Chinese, except in that Australians see Americans and Chinese as equally rude. It is also worth stressing that the differences between Australians’ ratings of Americans and of the Chinese are not large, save in the case of the ‘lazy’ to ‘hardworking’ dimension. Nonetheless, with the exception of Chinese respondents themselves, Australian respondents offer more negative stereotypes of Americans relative to the Chinese than any of the other countries in the data.
With the exception of Chinese respondents themselves, Australian respondents offer more negative stereotypes of Americans relative to the Chinese than any of the other countries in the data.
In-groups are almost always rated higher than outgroups, be they Americans or Chinese; Indonesians give Americans the highest ratings to Americans relative to in-group ratings, averaged across the four dimensions of evaluation used here. Indonesians see Americans as especially more hard-working and intelligent than themselves. This said, Indonesians have even slightly more favourable ratings of the Chinese relative to themselves, especially on the ‘lazy’ to ‘hardworking’ dimension.
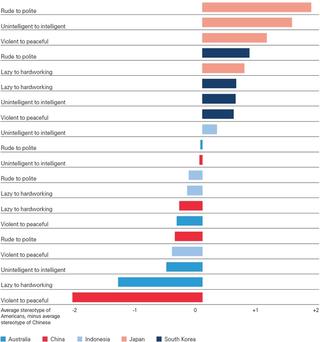
The twenty comparisons of American and Chinese stereotypical ratings (five countries, four dimensions) are plotted in rank order in Figure 13. Japanese strongly and consistently offer more favourable stereotypes of Americans than of the Chinese, followed by South Koreans. Australian and Indonesian respondents tend to rate the Chinese more favourably than they rate Americans.
Figure 12: Differences in average ratings of nationalities


Figure 13: Differences between stereotypes of Americans and stereotypes of Chinese, ranked from most pro-American (top of graph) to most pro-Chinese (bottom of graph). Colour and labels indicate country of respondents.
Nationalism and ethnocentrism
Ethnocentrism is the tendency to rate co-ethnics (or, in this case, co-nationals) more favourably than other ethnic or national groups. Here we assess ethnocentrism by examining differences in average stereotypical ratings for in-groups and out-groups. For each country, we compute the average stereotype score assigned to in-groups (across the four evaluative dimensions), out-groups, and the difference between these two average ratings. Higher ratings for in-groups relative to out-groups are indicative of ethnocentrism or nationalism.
Figure 14 plots these three quantities for each country. Japanese respondents provide the most ethnocentric set of responses of the five countries surveyed here, and by a considerable margin; not only are Japanese evaluations of out-groups the most negative observed across the five countries surveyed here (driven largely by negative stereotypes of the Chinese), but Japanese respondents also report the most positive in-group evaluations (and by a wide margin). Chinese respondents are the next most positive about themselves and go on to record the second highest level of ethnocentrism across the five countries surveyed. South Korea follows closely behind, with Indonesia recording a modest level of ethnocentrism.
The reluctance of Australians to report positive stereotypes about themselves relative to these outgroups itself contradicts many stereotypes about Australians and may even reveal insecurity about Australia’s place in the Asia-Pacific.
Australians actually record small negative levels of ethnocentrism, displaying a slight tendency to rate the out-groups (Americans, Koreans, Japanese, Indonesians and Chinese) higher than themselves on the four evaluative dimensions. Australians never give themselves average ratings above those of all outgroups, on any of the four dimensions (Figure 11); recall that Australians rate themselves especially negatively on the ‘lazy’ to ‘hardworking’ dimension (the second most negative average in-group rating of the twenty in-group assessments in the data). Australians are the only set of respondents not to rate themselves ahead of the out-groups on at least one dimension. For instance, Indonesian respondents are not especially ethnocentric, on balance, but nonetheless rate themselves as the most polite and the most peaceful group of the six groups being considered. The reluctance of Australians to report positive stereotypes about themselves relative to these out-groups itself contradicts many stereotypes about Australians and may even reveal insecurity about Australia’s place in the Asia-Pacific. Another hypothesis is that Australian respondents are especially averse to reporting racial and ethnic stereotypes (a form of social desirability bias, operating even given the relative anonymity of a web survey); if true, this too would contradict some stereotypes about Australians.
Figure 14: Average in-group, out-group and ethnocentrism scores, by country of respondent. Ethnocentrism is the difference between average in-group and out-group scores. Vertical bars show 95 per cent confidence intervals. The zero point on the vertical axis corresponds to neutral stereotypes. In-groups are rated more favourably than out-groups except among Australian respondents.
Margins of error and weights
The poll has 750 respondents in each of the five countries. The survey was administered over the internet by YouGov, Inc, to respondents who have previously agreed to take surveys.
In reporting poll results it is conventional to refer to the half-width of a 95 per cent credible interval of a proportion estimated to be 50 per cent as the ‘maximum margin of error’. The maximum margin of error for a simple random sample of 750 is plus or minus 3.6 percentage points. That is, if a simple random sample of size 750 estimated a population proportion to be 50 per cent, then a 95 per cent credible interval around the estimate of 50 per cent would range from 46.4 per cent to 53.6 per cent.
The data is weighted to improve representativeness within each country. Unless otherwise stated, all analyses reported in this report (including all tables and figures) use weights. The weighted data cannot be considered a simple random sample, and the accompanying margins of error are inflated relative to those from a simple random sample by a factor that is increasing in the variance of the weights (nb. for a simple random sample, the weights would be all one and have variance zero). The weights in this data set have the following properties, by country:
Table 9: Properties of weights, by country

After weighting, the maximum margins of error for each country are (in percentage points): Australia +/-4.2, China +/-6.5, Indonesia +/-4.1, Japan +/-4.2 and South Korea +/-5.6. Note the relatively large variance of the weights in the data for China. As sample estimates get closer to 0 per cent or 100 per cent, the accompanying margins of error get smaller: sample estimates of 20 per cent or 80 per cent have the following MOEs (in percentage points): Australia +/-3.3, China +/-5.2, Indonesia +/-3.3, Japan +/-3.4 and South Korea +/-4.5.
Australia
Author: James Brown, Research Director and Adjunct Associate Professor, United States Studies Centre at the University of Sydney
Two events bookend recent Australian thinking on engagement with both Asia and the United States. In November 2011, then Australian Prime Minister Julia Gillard, together with US President Barack Obama, announced a series of joint initiatives to enhance and deepen the US-Australian alliance, which she described as a “bed-rock of stability in the region”. The leaders committed to increased engagement between US and Australian military forces including the rotation of US Marines and Air Force assets in northern Australia. The second event was the 2012 launch of Gillard’s white paper: ‘Australia in the Asian Century’, which articulated the importance of strengthened relationships with China, India, Indonesia, Japan and South Korea, and heralded a key challenge for Australians: how to benefit from what Asia will need next. It called for Australians to become “a more Asia-literate and Asiacapable nation”. Like the other countries represented in this survey, Australia has been pressed to manage shifting strategic relativities in Asia; acknowledging, understanding and accommodating China’s rise at the same time as facilitating the US rebalance to Asia and guarding against any US retrenchment — both actual and perceived. Australia’s real challenge in the past five years has been developing appropriate policy settings for a region in which militaries are rapidly modernising at the same time that economies are furiously integrating.
Much of the work in pursuit of this aim has occurred beyond the Australian public’s gaze, reflected in the industrious broadening of Australia’s array of layered and nestled diplomatic and security relationships within the region. Where discussions on Australia’s engagement with America and Asia have punctuated the public consciousness, it has been by brief coalescence around issues such as the Asian Infrastructure Investment Bank and the Trans-Pacific Partnership (TPP), at the time of bilateral leader visits, or through sharp and often shrill debate on controversial issues like Chinese leasing of Darwin’s port. Polling at these pulse points has captured Australian moods on international issues, but for the first time this survey puts them in a regional context and facilitates comparison with other US allies.
Key takeaways for Australian policymakers
The findings of this survey provide four key insights into Australian views on Asia and the United States. The first is that Australians appear significantly less enthusiastic about US influence in Asia and the ongoing role of the United States in stabilising the region than US allies South Korea and Japan. This difference is most pronounced in comparison with Japan, and the general discord between Australian and Japanese views on most issues is the second key insight this data yields. Thirdly, the data suggests that while Australians are acutely aware of competition in the US‑China relationship they are relatively sanguine on the potential for that competition to descend into conflict and somewhat ambivalent about any need to support US objectives in the region. Finally, Australians appear comparatively unaware of the region and particularly unaware of interrelationships between the United States and its Asian allies.
Public polling consistently reveals strong Australian affinity for the bilateral relationship with the United States and an enduring recognition of the importance of the ANZUS alliance for Australia’s security and prosperity.2 But often this is caveated by concern about the operation of the ANZUS alliance in an Asian contingency, particularly one that might require Australia to join US military action. This survey deepens understanding of Australian views in this regard and reveals that Australians are significantly less enthusiastic about the role of the United States in Asia than South Korea, Japan, Indonesia, and even China in some instances. Asked whether the United States is the country with the most influence in Asia only 22 per cent of Australians agree, compared with South Korea (60 per cent), Japan (48 per cent), Indonesia (47 per cent) and China (40 per cent). The survey suggests that Australians are significantly more likely to nominate China as the most influential country in Asia, even more so than Chinese respondents (69 per cent versus 56 per cent). Similarly, twice as many Australians as Japanese and South Koreans see China as the most influential country in Asia today (69 per cent for Australia, 39 per cent for Japan, 35 per cent for South Korea).
Australians seem to remain seized by the narrative that US power is declining in the region; 80 per cent of respondents concluding that the United States’ best years are in the past (a view that closely mirrors Chinese and South Korean views, but differs from Indonesian and Japanese views). Sixty-nine percent of Australian respondents judge that China has replaced or will replace the United States as the world’s leading superpower, a result that accords with Chinese views (67 per cent) and South Korean views (63 per cent) but not Indonesian (53 per cent) or Japanese (23 per cent) views. Asked to consider the impact of these shifting power balances, Australians remain fairly neutral. Of the five nations surveyed Australians have the most neutral response on the favourability of US versus Chinese influence in Asia and consider both to currently exert a positive influence on Australia.
Given recent trends to strengthen Australia’s strategic relationship with Japan, both bilaterally and through mini-lateral arrangements, the discord presented in these results between Australian and Japanese views is important to note.
Given the recent strengthening of Australia’s strategic relationship with Japan, both bilaterally and through mini-lateral arrangements, the discord presented in these results between Australian and Japanese views is important to note. China-Japan rivalry is a clear theme running through many of the survey results and most likely underpins the strong levels of Japanese support for the United States in the region. Australian respondents are significantly more positively inclined to a stronger relationship with China than Japanese respondents. Asked whether China is helping or harming the region, a net nine per cent of Australian respondents take a negative view, with Japanese respondents recording a negative net percentage of 60. This is reflected in the differing views that respondents from Australia and Japan have on the trajectory of the US-China relationship, with 34 per cent of Japanese respondents characterising the US-China relationship as fearful, compared to just 17 per cent of Australian respondents. These discordant views are mirrored in responses to a question asking which country is most likely to be responsible for starting a conflict in the region in the next ten years. Thirty-seven per cent of Japanese respondents assess China as the most likely compared to 17 per cent of Australian respondents.
The third insight this data yields is that while Australians are cognisant of competition between the United States and China in the region, they are inclined to judge the outcomes of that competition to be benign. Seventy per cent of Australian respondents view the United States and China as competitors, the highest of all countries surveyed. Seventeen per cent of Australians see China and the United States as fearful of one another. Yet only 12 per cent of Australians think the United States and China are ‘very likely’ or ‘extremely likely’ to end up in conflict. A higher number of Australians judge it likely that there will be conflict between the United States and Russia (21 per cent). This benevolent view of US-China competition is not new in Australian public polling opinion; other polls have recorded similar results in recent years.3
The final takeaway from these responses is the significant lack of regional awareness among Australian respondents, particularly when it comes to understanding the US alliance system in Asia. Forty two per cent of Australians are unaware that Japan is a US ally, whereas results in China (14 per cent) and South Korea (16 per cent) are much lower. Similarly high numbers of Australians (36 per cent) are unaware of the US-Korean alliance. Intriguingly Australian respondents are as unaware of the TPP as their Chinese counterparts, with one in two Australians professing ignorance of the trade deal that their country has recently pledged to join. This is not to suggest that Australians are ignorant of foreign policy issues; 54 per cent for example, were able to correctly identify US vice president Joe Biden and his role. Perhaps this is due to the fact that of all countries surveyed on whether they would attend an American university, Australians were the most likely by far to choose to stay at home (Table 6).
Implications for the region
Australian responses to this survey might have three implications for the region. Firstly, US policy makers will be attentive to the seemingly apparent ambivalence in Australian views on China as well as the high proportion of Australians who think that China has already or will become the world’s leading superpower. These findings will bolster views among some Americans that there is a creeping softness in Australian support for the US alliance, and a need for the United States to both better reassure Australia as well as guard against the possibility of any alliance cheating.
The second implication for the region is the conclusion this data lends to the notion that Australians are either relatively na.ve about the potential for further tensions and possible conflict in the region, or feel they are insulated from the consequences of any major power competition in Asia. Such public opinion could put a handbrake on any Australian government initiatives designed to deter conflict in Asia or to deepen regional stability. Particularly telling, just four per cent of Australians surveyed identified a possible South China Sea conflict as being the biggest possible risk to Australia. Finally, the sharp divergence of Australian views on US-China issues from those in Japan should be viewed with interest in Washington, Tokyo, and Canberra. Australians might not automatically identify with Japanese concerns over China, nor appreciate what is driving a closer Japan-US relationship. Other recent polling has shown that Australians have a strong sense that they should stay neutral in the event of any disagreement between China and Japan.4 That could be somewhat problematic for efforts underway in all three capitals to build closer relations between the three countries through new minilateral groupings and initiatives.
Country specific questions
Questions asked exclusively of Australians in this survey have yielded interesting results, particularly in parsing issues highly relevant to the future trajectory of a tightening Australia-US relationship. The implementation of the rotational presence of a US Marine Task Force in Darwin as well as the unfolding plans to rotate more US Air Force aircraft through airfields in northern Australia should be cognisant of responses to questions about a continued military presence in Australia.
Asked whether Australia should reduce, increase, or maintain US basing in Australia at current levels, an overwhelming amount of Australians believe that US basing should remain the same (59 per cent) rather than reduce (18 per cent) or increase (24 per cent). While age was not as much of a factor in responses on this question as might have been expected, political affiliation was. Only 10 per cent of Greens voters were inclined to support additional US basing in Australia. Views on basing between Labor and Liberal voters did not sharply diverge as they have at times historically, though Labor voters were marginally more inclined not to support a US basing presence in Australia.
Asked to consider the biggest threat to Australia, Islamic extremism was by far the most concerning issue to Australians (47 per cent); concern about economic slowdown in China was considered the greatest threat by 29 per cent of Australian respondents.
As previously mentioned a mere four per cent of Australians identified disruption to trade in the South China Sea as the biggest threat to Australia. Asked whether their identified threat was made more likely as a result of being allied with the United States, 39 per cent of Australians agreed and 50 per cent responded that the alliance made no difference to the issue. This should give pause to governments in Canberra and Washington: Australians clearly do not identify a security benefit from the significant intelligence and policing cooperation that takes place within ANZUS.
Finally, Australians were asked whether the alliance with the United States helps or hinders Australia’s relationships in Asia and results in this regard were compelling. Forty-two per cent of Australians believe the alliance neither helps nor hinders, 20 per cent believe it helps to an extent and 40 per cent of Australians believe being allied with America hinders Australia’s relationships in Asia — a result consistent across voters from both of Australia’s major parties.
As the United States looks to recalibrate its rebalance to Asia, evolve its model for Asian alliances, and intensify cooperation with Australia on issues in Asia, this result suggests Australian and American policy leaders have some work to do in bringing the Australian population along with these efforts. Several prominent Australian foreign policy experts have called for the regional security benefits of the Australia-US alliance to be better articulated to the Australian public. This survey shows that need remains as critical as ever.
China
Authors: Professor Shao Yuqun, Executive Director, Dr Zha Xiaogang, Research Fellow, Qiu Xudong, Research Fellow, Shanghai Institutes for International Studies
Positive evaluation of China’s foreign policy and its development
The survey results show that China enjoys a relatively positive image in terms of its regional influence, foreign policy and future development. Among the five countries surveyed, perception of the strength of China’s influence in the region, particularly in relation to trade, is high and positive for all countries’ respondents, with the exception of Japan.
Based on this recognition, most respondents of the other four countries surveyed (Australia, Indonesia, Japan and South Korea) have high expectation on further developing their countries’ bilateral relationship with China.
China’s increased influence in the region over the past years is widely recognised, with results of the survey meeting expectations. What is interesting is that most respondents evaluate China’s influence as positive; an attitude which has not been reflected in media reports.
This may be the result of China’s long-standing commitment to peaceful development and its aim to construct good relationships with all the countries in the region. At the same time, China has always advocated respect for other countries’ sovereignty and does not intervene in other countries’ internal affairs. This is often contrasted with the United States’ approaches to regional and global issues, which have often resulted in war and turmoil, and cements the general endorsement of the region for China’s foreign policy and the influence needed to carry out Chinese policies. Obviously, Japanese respondents are relatively more reserved on China’s influence. This reservation can be understood largely due to historical differences that China and Japan have, which have again been brought to the fore with the recent Diaoyu Islands disputes.
The survey results show a strong endorsement, by Chinese respondents, of China’s general foreign policy. Many Chinese citizens understand the importance of diplomacy in maintaining and supporting peace and development and strongly believe in respecting the sovereignty and domestic affairs of other countries. This support is rooted in the history of external invasion, imperialism and colonialism from which China has suffered. Due to China’s status as a developing country, citizens of China understand that developing the economy and improving living standards, while ensuring a stable regional and international environment, is of paramount importance. Chinese people are incredibly proud of the increased positive influence that China has been able to project through its peaceful foreign policy, which has been necessary in establishing and maintaining China’s fast economic growth. China is especially viewed positively among other developing countries, largely due to a friendly and peaceful foreign policy.
The benefits of trading with China are clearly seen in the respondents’ answers from the other four countries surveyed, with the expectation of a long-term bilateral trade relationship with China being viewed positively. China is the largest trading partner of all four countries, with each experiencing the positive benefits of this relationship. Even the Japanese respondents, who have a relatively negative evaluation of China’s growing influence, acknowledge the positive effects of doing business with China. It is clear that with increased trading opportunities and China’s potential for further growth, respondents from the four countries clearly indicate they would like to see a stronger bilateral relationship between China and their own country.
Perception of the US role in Asia
Chinese respondents believe that the United States has a slightly more negative than positive impact on the Asia-Pacific region. Respondents also believe that the influence of the United States has moderately declined in the past ten years, and believe that this trajectory will continue over the next ten years. The US economic slowdown, the Asia policy of the current Obama Administration, the US-Japan alliance and their presence in the South and East China Seas contribute to this negative trend.
The 2008 recession can explain the apparent retreat and diminishing presence of the United States in the international arena; such as in Afghanistan, Iraq and the Middle East, and in South Asia. Chinese respondents do not view future economic development in the United States positively, due to the slow economic recovery, and believe that US influence is on a decline. China’s positive economic growth rates over the last decade are in strong contrast to the United States, especially in socio-economic sectors.
The rebalance to the Asia-Pacific strategy of the Obama administration has returned US engagement to the region, though with more restrained diplomatic and military resources. Since President Barack Obama took office in 2008, the past seven years have witnessed a refocus on Asia-centric policy. The Chinese public would contend that these policies, in effect, are being used to demonise China’s peaceful growth and to contain China’s development in the region. Though the Obama administration reiterated on several occasions that the rebalance strategy was not meant to contain China’s rise, the Chinese public would furiously disagree. The Chinese public believe that these American policies, especially regarding the Diaoyu Islands and South China Sea conflicts, purposefully exploit confrontational issues in Asia to further strengthen its alliance ties in the region and therefore attempt to encircle and contain China.
Moreover, regional development over recent years in the South China Sea and the East China Sea is a significant indicator to the Chinese public that US influence in Asia is decreasing. Japan, backed diplomatically and militarily by the United States, is arguably to blame for the ongoing regional tension. The majority of the Chinese public tend to believe that Japan, misled and stirred by the Abe administration, is a potential ‘trouble-maker’ or ‘peace-breaker’ in Asia. The survey results also show that the Chinese public believe that Japan would be the country that would most likely start a conflict in the Asia-Pacific, with a majority of respondents considering it most likely, out of all options given, that there would be a serious military conflict between China and Japan. It is well understood that Sino-Japanese relations have continued to dominate the Chinese public’s attention in recent years. Regional security and the bilateral relationship between China and Japan has been further complicated by topics of disagreement such as the ways in which Japan teaches the history of the Second World War, including the invasion of China, and ongoing conflict over ownership of the Diaoyu Islands in the East China Sea.
On the South China Sea front, although the United States is not a signatory member of the United Nations Convention on the Law of the Sea (UNCLOS), it insists that China ‘abide by’ UNCLOS in the vicinity of the South China Sea, and continues to overstate the issue of ‘freedom of navigation’. The Chinese public contends that China has never violated the freedom of navigation in the South China Sea, and finds it difficult to understand why the United States is preoccupied with this very unlikely scenario. The Chinese public also expresses antipathy for the high frequency of US fighter jets and warships coming close to China’s airspace and territorial seas for intelligence gathering.
Regarding Japan-US relations, the Chinese public believes that the United States uses security and military collaboration with Japan to reinforce its own interests while paying little attention to Chinese concerns over issues of war history, in which Japan was the aggressor. If President Obama, hypothetically, expressed that his administration would support Japan in the East China Sea islands’ dispute, the Chinese public would be incensed. This would also reveal the true intentions behind the rebalancing policy in the region.
Concern with the future development of the US-China relationship
Though the survey does not look at the US-China relationship directly, there are indicators of regional concern in the survey results. There are three indicators that should be highlighted in terms of the US-China relationship.
Firstly, most respondents think China has been or will be the most influential country in the region. Secondly, most respondents think the best years for China are still to come and those of the United States have already past. Thirdly, most respondents of the five countries think that it is likely that the United State and China will have a serious military conflict.
The three indicators are logically consistent. The respondents have strong confidence that Chinese development has positive upward momentum. The natural result is that China’s influence in this region will replace that of the United States, which could cause frustration to the latter. It can be fairly deduced that respondents generally know of the differences that the two countries have, especially regarding hot spot issues and the regional and security order; it is thus not surprising that most of them would be concerned about possible military conflict between the United States and China. Chinese respondents have been buoyed by the decades of economic growth experienced since China’s economic reform was initiated, and have very high confidence in China’s future development potential and competitiveness against the United States.
To some degree, the serious political mess in the United States, such as the inefficient relationship between congress and the administration has strengthened Chinese peoples’ belief in China’s current political system and its reform-oriented policy design.
The Chinese public contends that China has never violated the freedom of navigation in the South China Sea, and finds it difficult to understand why the United States is preoccupied with this very unlikely scenario.
However, the survey results show that the respondents consider the possibility of serious military conflict between the United States and China as ‘somewhat likely’ or ‘slightly likely’ rather than ‘extremely likely’ or ‘very likely’. This suggests that although people in this region have concerns over the US-China relationship, they believe that the bilateral relationship can be managed or shaped in a more stable direction. This corresponds with the definition of the US-China relationship by many academics and government officials as ‘cooperative and competitive’. It also shows that the public does pay close attention to this very important bilateral relationship. The result also shows that the public would hope that both the United States and China can better manage their relationship, to the extent that respondents may hope that their respective governments intervene to prevent regional conflicts.
There is an interesting contrast between the respondents from Australia, Japan, South Korea and Indonesia on the possibility of serious military conflict between China and the United States. The former three countries, all military allies of the United States, place less expectation on ‘extremely likely’ or ‘very likely’ that military conflict would arise between China and the United States than Indonesia, which is a large developing country in the region. One explanation could be that the three more developed countries have a greater understanding of the importance of the intertwined economic relationship between China and the United States. This could lead to the reasonable suggestion that economic interdependence would play some kind of containing effect over possible military conflicts between China and the United States. However, as a developing country and more geographically proximal to the disputed South China Sea area, Indonesian respondents could place more emphasis on traditional security concerns than the closeness of economic interdependence.
China-Japan relations a concern for the Chinese public
Though it is widely reported and recognised in China that the United States is the strongest competitor in the Asia-Pacific and globally, Chinese respondents think that Japan is the country most likely to have a serious military conflict with China. There could be many explanations for this.
Firstly, although the Chinese public does not like many of the US behaviours and actions in the Asia-Pacific, and especially in the East Asia region, they do not think that there is a fundamental conflict of interest between China and the United States. Within China there is a level of admiration towards US culture and education. The lack of a fundamental conflict of interest would likely mean that conflict between China and the United States will stay in terms of economic competition and struggle for global influence, rather than short-term pockets of military conflict. However, the serious disputes over the Diaoyu Islands and the continuous efforts of the current Japanese administration to revise their military systems have given the Chinese public a sense of urgency.
Secondly, the Chinese public has a long memory of Japan’s abrupt invasions in modern history. They are still concerned Japan will try to disrupt China’s development by starting a new military conflict and then involve the United States. Recent Japanese involvement in the South China Sea disputes has strengthened this concern.
Chinese respondents are very supportive of the Chinese government’s foreign policy and have confidence in the direction of China’s development.
In general, Chinese respondents are very supportive of the Chinese government’s foreign policy and have confidence in the direction of China’s development. The Five Principles of Peaceful Coexistence, which the government draws heavily upon, is consistent with Chinese traditional culture and philosophy and is strongly endorsed by its citizens. The Chinese people desire continued economic development and a stable international environment. In this sense, the Chinese public gives high praise to its government’s performance.
As a very optimistic indicator, around 40 per cent of Chinese respondents do not think that there will be any serious military conflict across the Taiwan Straits. This change is very encouraging because cross-Strait conflict has always been one of the major security concerns for the Chinese public. There could be several reasons for this positive change.
Firstly, cross-Strait relations have entered into a peaceful development stage and the exchanges and communications between the two sides are becoming closer.
Secondly, although there are still pro-independence groups inside Taiwan, the majority of the Taiwanese people support keeping the status quo and maintain peace between the two sides of the Strait.
Thirdly, deterred by internal and external factors, the pro-Independence groups inside Taiwan are afraid of seeking legal independence.
Stereotypes of the Chinese public
The Chinese public portray themselves with positive stereotypes including ‘hardworking’, ‘intelligent’, ‘polite’, ‘peaceful’, ‘open-minded’, and ‘caring about international and regional affairs bearing globalised and regionalised mentality’. These views demonstrate strong Chinese national confidence, and this buildup of momentum has helped shape a good understanding of global and regional issues among the Chinese public.
These confident and positive attitudes derive from the overall development of the national economy over the past three decades. The Chinese public has, for a long time, had great confidence in China’s international presence, and trust that with the current rate of development China will have a much bigger say in the Asia-Pacific region. China’s economic volume climbed to world number two in 2012 after replacing Japan in terms of GDP. If China’s economy continues to rise about seven per cent annually, it is estimated that the economy will be level with that of the United States in the next decade or so. The volume and growing velocity of China’s economic rise will put China in an unprecedented position in contemporary history to play a much more significant global and regional role.
The full range of educational and cultural exchanges between China and the West has nurtured the Chinese public’s understanding of global issues. Since the opening-up policy of the late 1970s, China has opened the door and welcomed exchanges from around the world after a decades-long period of insulation from the outside world. The growing rate of students going overseas for tertiary education exemplifies the eagerness of the Chinese to learn and exchange with the world. With the Sino-US people-to-people exchanges, the number of Chinese students who choose to study in US colleges and universities continues to increase. Growth in the international education sector plus favourable policies such as facilitation of visa policies furthers the momentum of this growth. The more students who choose the United States as their educational and training destination, the more intertwined the China-US relationship will become. The growing number of students can play a unique and constructive part in bridging bilateral relations. Beyond the United States, Chinese students are choosing to pursue tertiary education across the world, including in Europe, Australia, New Zealand and Singapore.
Finally, the Chinese public views the future with an optimistic outlook. This outlook is supported by China’s rapid, stable and upward growth rate when compared with other countries in the developing world. Chinese people also generally display favourability for the domestic socio-economic governance. With the market forecasting expansion and growth, young Chinese people have great opportunities to use their education and professional skills to create a positive future for themselves and for China. Moreover, Chinese economic trends show a slowdown, but in a moderate and stable fashion. No drastic change in the economy is anticipated by the Chinese government or people. Lastly, ordinary Chinese people would be happy to see China’s deepening integration into the world with a rise of status in the international arena.
Japan
Author: Yuri Imamura, Staff Writer, The Asahi Shimbun
A survey conducted in October 2015 by the United States Studies Centre at the University of Sydney in Australia asked people in Japan, China, South Korea, Australia and Indonesia their impressions of what presence the United States and China have in the Asia-Pacific region.
Among the major results obtained for the Japanese sample is a strong desire for a continued close relationship with the United States, while also holding strong concerns about the emergence of China.
Two related questions were asked: which nation has the most influence in Asia today, and which will have the most influence in ten years’ time.
Sixty per cent of South Koreans, 48 per cent of Japanese and 47 per cent of Indonesians say the United States has the most influence today. These results are in sharp contrast to Australia, where 69 per cent of respondents say China has the most influence today.
As for ten years into the future, the four nations, with the exception of Indonesia, say China. However, while the percentages exceeded 60 per cent in South Korea and Australia, only 34 per cent of respondents in Japan say China. The percentages that say the United States will still have the most influence ten years from now dropped to between 11 and 34 per cent in all nations.
Respondents were also asked about the level of influence the United States has over their own nation. In both Japan and South Korea, the combined total of respondents who chose ‘a great deal’ and ‘a lot’ exceeded 80 per cent.
Another question asked respondents if the United States did ‘more good or harm’ in the Asia-Pacific region. In all five nations, the most popular response is ‘about the same amount of good and harm’.
Respondents were also asked about how their relationship with the United States should be. The nations where the most popular response was ‘about the same’ were Japan (40 per cent), Australia (42 per cent) and South Korea (36 per cent). All three are allies of the United States. Meanwhile, about 60 per cent of the respondents in China and Indonesia said the relationship should be strengthened.
Questions about China’s influence and the view of the US-China relationship produced a conspicuously negative impression of China among Japanese respondents.
In the question about whether China did ‘more good or harm’ in the Asia-Pacific region, 33 per cent of respondents in Japan chose ‘much more harm than good’, the most negative of the five choices. That figure was much higher than the percentages (between two and seven percent) for South Korea, Australia and Indonesia. A total of 71 percent of Japanese respondents chose either ‘much more harm than good’ or ‘somewhat more harm than good’. The most popular responses in the three other nations, excluding China, was ‘about the same amount of good and harm’, chosen by 65 per cent of South Koreans, and 45 per cent of Australians and Indonesians. When asked about China’s influence on their own nation, a combined 61 per cent of Japanese respondents said either ‘a great deal’ or ‘a lot’.
In September last year, which marked the 70th anniversary of the end of the Second World War, Japan passed national security laws. The survey was conducted the following month, but during debate on the legislation, recent moves by China were highlighted, including the territorial dispute with China over the Senkaku Islands and the reclamation work by China in the South China Sea to create artificial islands.
2015 was also a year when issues of historical understanding involving Japan and China were highlighted. Among the events that focused attention on such issues were the statement released by Prime Minister Shinzo Abe in August to mark the 70th anniversary of the end of the war as well as the military parade in Beijing in September to celebrate the war victory over Japan.
Perhaps because of such issues the question about the positive or negative influence of China on their own nation led to a combined total of 73 per cent of Japanese respondents choosing ‘a little negative’, ‘negative’ or ‘very negative’. A strong sign of the distrust toward China can be seen in the 19 per cent of Japanese respondents who chose ‘very negative’. In the three other nations, excluding China, the result was only two or three per cent.
At the same time, the current situation consists of yearly increases in the number of Chinese tourists visiting Japan, as well as the spread of the fad term ‘binge shopping’ to describe what those tourists do in Japan. However, when respondents were asked about increasing trade with China, only a combined 32 per cent of Japanese respondents chose either ‘very good for country’ or ‘good for country’. In the three other nations, the figure was between a combined 46 per cent and 64 per cent. In Japan, the combined total for ‘very bad for country’ and ‘bad for country’ was 35 per cent, slightly higher than the positive responses.
Respondents were also asked about how the Japan- China relationship should develop. A combined 39 per cent chose ‘much stronger’, ‘stronger’ or ‘a little stronger’. Twenty-eight per cent chose ‘about the same’ and a combined 33 per cent chose ‘much weaker’, ‘weaker’ or ‘a little weaker’. The figures show that while many Japanese may have a sense of distrust toward China, there is also the grudging acknowledgement that a relationship with China must be maintained.
Another question that clearly shows a difference of opinion between respondents in Japan and those in the other nations, concerned one that asked respondents to describe the relationship between China and the United States. In all the four other nations, the most popular choice was ‘competitors’, but in Japan the most popular response was ‘fearful’ at 34 per cent. Another 15 per cent in Japan chose ‘enemies’. For both responses, Japan had the highest percentage of the five nations.
Respondents were also asked if China would become a leading superpower. In the four other nations, the most popular choice between 41 and 57 per cent of respondents was ‘China will eventually replace the United States as the world’s leading superpower’. But in Japan, 78 per cent chose ‘China will never replace the United States as the world’s leading superpower’.
Before the Trans-Pacific Partnership (TPP) free trade agreement was reached in October 2015, media in Japan carried many reports about the significance of the creation of a gigantic economic zone in the Asia-Pacific region, the advantages of being able to more easily export industrial products from Japan as well as the arrangement’s effects on agriculture. Perhaps because of the media coverage, 95 per cent of respondents in Japan said they had heard about the TPP, a much higher figure than those for the four other nations, where the figures were between 35 and 49 per cent.
South Korea
Authors: Dr James Kim, Research Fellow and Chungku Kang, Senior Research Associate, The Asan Institute for Policy Studies
South Korea faces a unique set of foreign policy challenges arising from China’s emergence, Japan’s renewed boldness, and a growing North Korean threat. One of the keys to overcoming this challenge rests on how policymakers in Seoul respond to the regional environment and how they manage the different domestic concerns arising from these trends. To the extent that leaders in democracies must face the political consequences of the choices that they make, it is useful to consider the different domestic preferences about the shifting regional context. In particular, we seek to examine how South Koreans see their neighbours when addressing these concerns. This survey of 3750 people from Australia, China, Japan, Indonesia, and South Korea provides useful insights. We place special emphasis on the data from South Korea (n= 750).5
Regional influence
South Koreans appear to see themselves at a critical moment — at a time when the centre of regional influence is shifting from the United States to China. When asked to name the most influential country in the region today, 60 per cent of South Koreans chose the United States, while 67 per cent saw China’s influence surpassing that of the United States in ten years (Figure 15). Cross-tabulation of these two trends shows that the attitudinal tilt towards China’s growing influence is free from views about the current status of the United States. That is, among those that identified the United States as the most influential country today, the majority (64 per cent) answered that China would be the most influential country in ten years. Likewise, the majority (76 per cent) identifying China as the most influential country today also identified China as the most influential country in ten years. Only a small minority (11 per cent) stated that the United States will be the most influential country in ten years.
Figure 15: Most influential country in Asia
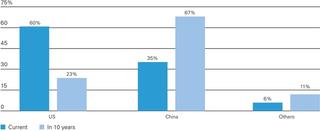
Although the bullish outlook on China’s future influence is consistent across all age groups, the older respondents tend to be more optimistic about China’s future than any other age category, with respondents in their 50s (73 per cent) being most likely to choose China as the most influential country in the future. It is also important to point out that more than 30 per cent of respondents aged 30 years and older have a tendency to state that China is the most influential country today compared to 19 per cent of individuals in their 20s (Table 10).
Table 10: Most influential country in Asia by age group — United States vs China (%)
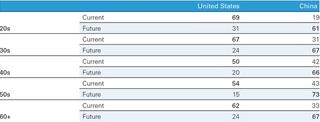
This finding mirrors results from the question about US influence in Asia over the past ten years. Overall, the survey data indicates that public opinion is less decisive on this issue, with 38 per cent of South Koreans agreeing that US influence in Asia has decreased over the past ten years and 62 per cent stating that it has either grown or remained unchanged (Table 11). It is striking to note that more than half of respondents in their 20s see US influence as having grown over the past ten years. Meanwhile, a slim plurality in all other age groups (with exception to those in their 50s) sees US influence as decreasing. A plurality of those in their 50s tend think that US influence will remain unchanged.
Table 11: US influence in Asia compared to ten years ago (%)

When survey respondents in South Korea were asked whether they thought the best years for the United States was in the past or the future, eight out of ten selected the past.6 Although this view is generally consistent across all age groups, 38 per cent of those in their 20s stated that the best years for the United States are still to come (Figure 16). Taken together these trends suggest that younger respondents seem more reluctant to concede a rapid shift in relative power structure as the outlook on US regional hegemony is rosier among youth than older cohorts.
Figure 16: Best years for the United States by age group
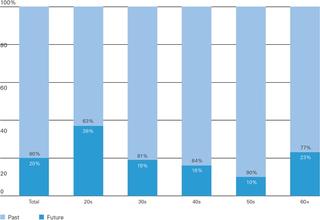
Types of influence
When asked about the qualitative difference in the kind of influence that the United States and China have had on the region, there is a marked difference of opinion. South Koreans, in general, have a more favourable view about the role of the United States compared with China, as shown by the difference in the percentage of those individuals who see ‘more good than harm versus more harm than good’ (i.e. net ratings) (Table 12).
Compared to Australia, China, Indonesia, and Japan, South Korea records the highest net percentage (33 per cent) favouring the positive influence of the United States in the region. While South Koreans also see China as doing ‘more good than harm’, the net percentage difference of those seeing China doing ‘more good than harm versus more harm than good’ (11 per cent) is a third of that for the United States. In general, most South Koreans think that China’s influence in the region is neither good nor bad, with 65 per cent answering that China’s influence in the region is ‘about the same amount of good and harm’.
Table 12: Views on US and Chinese influence in the Asia-Pacific region (%)
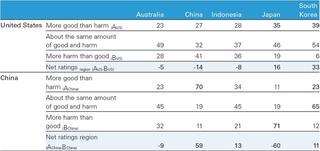
We can make several interesting inferences about these trends. First, South Koreans seem to hold favourable views about the impact that the United States has on the region, more so than any other nations polled. But it is also true that South Koreans hold favourable views about China (albeit slightly less so than that of the United States) unlike the respondents from Japan (Table 12).
Table 13: Nature of US and Chinese influence on respondent’s country
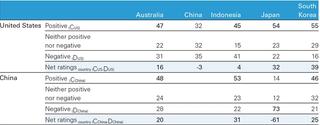
These sentiments are driven, in part, by the effect that the United States and China has had on South Korea’s economy and security. For instance, China is South Korea’s largest trading partner, while the United States is the second largest trading partner and an ally. There are more than 28,500 US forces deployed on the Korean Peninsula today. Within this context, when it comes to questions about their impact on South Korea and the region, the large net positive ratings for the United States and China is less than surprising (Tables 12 and 13). With the exception of Australia, the perceived net regional impact (Net ratingsregion) is correlated with perceived net country-specific impact (Net ratingscountry) according to the respondent’s country. A closer look at the South Korean dataset in particular shows that the correlation is even more pronounced when we compare the conditional relative frequency of US and Chinese influence on the region and country (Table 14).
Table 14: The United States’ and China’s influence on the region and South Korea (%)
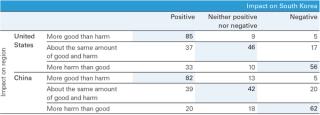
On the one hand, these trends suggest that there is some interaction in perception about the role of these great powers at the regional and country level. On the other hand, they also reflect Seoul’s policy of ‘strategic ambiguity’ or balancing the approach to its relations with both the United States and China for a good part of the Park Geun-hye presidency (up to 2015). That is, the South Korean public opinion could have been shaped by the government’s policy and the continual effort to justify this choice through public diplomacy.
China as superpower?
How do respondents from five surveyed nations see the relative power status of China and the United States? With the exception of Japan, respondents seem to agree that China has already, or will eventually, replace the United States as the world’s leading superpower. As shown in Table 15, Japan is the only country where nearly 80 per cent of respondents state that China will never replace the United States as the world’s leading superpower. Indonesia is split among those that see China eventually replacing the United States versus never replacing the United States as a leading superpower.
Table 15: Views on superpower (%)

South Koreans show a unique pattern, with the split being relatively even among those who think that China has already/will eventually replace the United States and those that do not think this will ever happen. This pattern appears to be driven in part by partisanship, as more self-identified conservatives and independents tend to be more dismissive about the likelihood of China replacing the United States as the world’s leading superpower than progressives (Figure 17).
Figure 17: Views on superpower by party affiliation 7 (%)
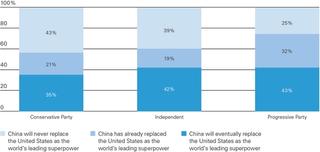
Source of conflict
When asked about the potential source of conflict in the region, respondents from all countries (except China) see North Korea as the single greatest threat (Table 16). Japan is identified as the second greatest source of conflict for respondents in China and South Korea, while China looms large for respondents in Japan and Australia. For the Indonesians, the United States is the second greatest threat after North Korea.
Table 16 Source of conflict in the Asia-Pacific region 8 (%)

South Korean threat perception appears to be driven in part by partisanship as progressives and independents tend to see Japan as the second most likely source of conflict in the region after North Korea (Figure 18). While respondents from all three parties see North Korea as the single greatest source of conflict, conservatives and independents tend to place greater weight on this threat than progressives. This is reasonable given that progressives tend to favour more pro-engagement policies vis-.-vis North Korea while conservatives and independents tend to favour a more hawkish stance. Finally, both conservatives and progressives tend to see their own country as a source of potential conflict.
Figure 18: Source of conflict in Asia by party affiliation (%)
