Executive summary
Paid and unpaid work
In Australia, female employment is overwhelmingly characterised by part-time (or casual) work, in both actual and ‘preferred’ working hours; whereas in the United States, full-time employment is both the actual and ‘preferred’ norm, even among women with young dependent children.
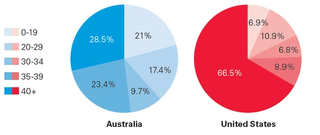
Figure 1: Distribution of female workers (%) by hours worked, 2014
Source: OECD Family Database. LMF 2.1 Usual weekly working hours among men and women by broad hours groups, viewed on 1 February 2016 at http://www.oecd.org/els/family/database.htm
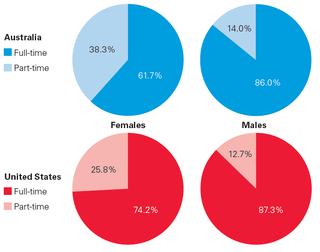
Figure 2: Full-and part-time workers (%), by sex (aged 16+), 2014
Sources: For Australia, data drawn from OECD Economic Database, OECD.stat, Incidence of FTPT employment, common definition, accessed on 1 February 2016. For US, data drawn from U.S. Department of Labor, Women’s Bureau, Usual weekly hours at work, by sex, viewed on 1 February 2016 at http://www.dol.gov/wb/stats/usual_weekly_hrs_sex_2014_txt.htm
Labour force participation
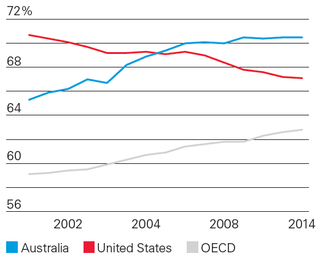
Both the United States and Australia have historically enjoyed female labour force participation rates that are above the average for other industrialised countries. In the decade to 2014, however, Australia witnessed a five per cent increase in the proportion of women participating in paid employment, while the United States witnessed a five per cent decline, attributable in part to the global financial crisis, the Great Recession, and also to the first wave of retirement among the baby boomer generation.
Figure 3: Trends in female labour force participation (%), 2000-2014
Source: Labour force by sex and age, accessed at OECD.stat on 1 February 2016.
Maternal employment
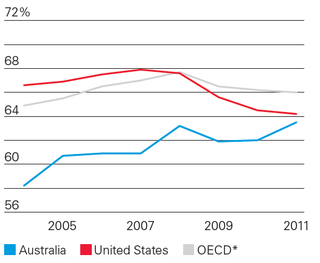
Australia and the United States lag behind other industrialised countries with respect to maternal employment. Australia has witnessed an increase in maternal employment compared to the United States, where maternal employment rates have fallen markedly over the past decade.
Figure 4: Trends in maternal employment (%), 2004-2011
Source: OECD Family Database, LMF 1.2 Maternal Employment, viewed on 1 February 2016 at http://www.oecd.org/els/family/database.htm *Based on unweighted average of 16 OECD countries for which time frame data was available.
Women in corporate leadership
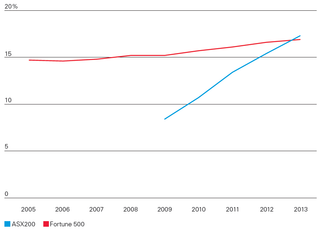
Since the implementation of voluntary and statutory codes aimed at increasing the transparency of corporate management structures Australia’s biggest companies have doubled the proportion of women holding board directorships, from an 8.4 per cent share in 2009 to 17.3 per cent share in 2013. In the United States the share of female directorships in Fortune 500 countries rose from 15.2 per cent to 16.9 per cent — less than two percentage points — over the same time period. The proportion of large businesses with female chief executives has remained relatively unchanged in both countries, hovering between three and four per cent of the biggest companies in Australia and the United States over the past decade.
Figure 5: Percentage of female directorships on ASX200 boards, 2009-2013, and Fortune 500 board seats held by women (%), 2005-2013
Sources: AICD (2015), Statistics, Appointments to ASX 200 Boards, accessed on 3 February 2016, http://www.companydirectors.com.au/director-resource-centre/governance-and-director-issues/board-diversity/statistics; http://www.catalyst.org/knowledge/statistical-overview-women-workplace
Gender pay gap
The gender pay gap in both countries remains pervasive and persistent, sitting at around 18 per cent in both countries despite sustained focus on this issue. Women in both countries contribute significantly more time to household labour than men, although the distribution of responsibilities is more egalitarian among couple households in the United States than it is in Australia, perhaps owing to the prevalence of women’s full-time employment in the United States.
Statutory entitlements
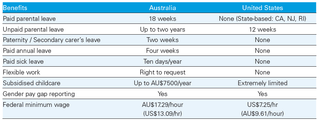
In 2010, Australia introduced a national system of paid parental leave, leaving the United States as the only major industrialised country without a national statutory entitlement to paid leave. Women in Australia also enjoy up to two years of job protected unpaid parental leave, compared to just 12 weeks of unpaid family or medical leave in the United States. Paid parental leave has been highlighted as a key policy issue by President Barack Obama — and Democratic presidential nominee Hillary Clinton — but the debate over whether and to what extent the US government should regulate work-family policy is still hotly contested.
Table 1: Statutory entitlements for workers in Australia and the United States
Educational attainment
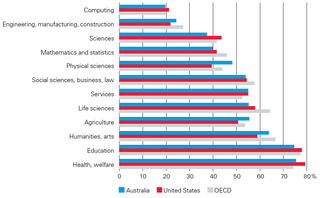
Women in Australia and the United States have high and growing levels of educational attainment. Throughout the past decade, young women in both countries have been more likely to complete an undergraduate degree than their male colleagues, although this gender gap largely disappears at the postgraduate level. Women in both countries are also over-represented in the fields of art, education, health and social services, and under-represented in fields of computer science, engineering, physical sciences, mathematics and statistics.
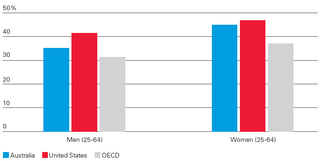
Figure 6: Tertiary attainment rates (%), by sex, 2013
Source: OECD (2013). Indicators of Gender Equality in Education, viewed on 30 January 2016, at http://www.oecd.org/gender/data/populationwhoattainedtertiaryeducationbysexandagegroup.htm
Figure 7: Tertiary qualifications awarded to women (%), by field, 2010
Source: OECD. Indicators of Gender Equality in Education, viewed on 30 January 2016 at http://www.oecd.org/gender/data/education.htm, data extracted from OECD.stat. 2010 was the most recent year for which national and OECD data was available.
Introduction
For much of the past half-century, Australia lagged behind the United States with respect to female labour force participation and in relation to women’s representation in senior and strategic organisational roles. Over the past decade, however, Australia has drawn equal with — and on some measures begun to surpass — the United States. Today, the standing of women in the United States and Australia is remarkably similar, despite significant differences regarding the gendered distribution of paid and unpaid work, and the regulatory frameworks governing employment in the two countries.
Our analysis is based on publicly available data from official sources. At the national level, the majority of data came from the U.S. Department of Labor’s Bureau of Labor Statistics, and the Australian Bureau of Statistics. For cross-country comparisons, data came from the Organisation for Economic Cooperation and Development (OECD) Economic and Family Databases, or OECD.stat.
This report seeks to lay the foundations for future comparative work in the United States and in Australia on women’s working lives. We have attempted to highlight both differences and convergences in the United States and Australia.
Our analysis spans education, the nature of labour force engagement, gender gaps in paid and unpaid labour, women’s representation in corporate leadership, the national policy frameworks and organisational policies which contextualise and can leverage gender equality and inequality.
Ultimately, through this and our future work, we aim to understand both the outcomes for women in work and leadership, but also to identify levers available to organisations, government and other stakeholders to enable gender equality in careers and leadership.
Female labour force participation
Australia:
- Women’s labour force engagement in Australia falls below the OECD average when young children are present in the household, but increases above the OECD average as children grow older.
- Part-time work is a defining feature of female and maternal employment in Australia, and is prevalent at rates well above the OECD average.
- Most full-time working women in Australia express a desire to work fewer hours; and most working mothers in Australia prefer part-time hours.
United States:
- Women’s labour force engagement has fallen sharply in the United States since 2007, owing partly to the effects of the global financial crisis and the Great Recession, and also to the first wave of retirement among the baby boomer generation.
- Maternal employment rates have fallen sharply and are now well below OECD levels.
- Maternal employment in the United States is characterised mainly by full-time employment. Women with children are more likely to be working full-time or not at all, than to be working part-time.
- Women with children are more likely to report overemployment than other workers, but a significant majority of women express satisfaction with their working hours. One possible explanation is the attachment of employment benefits such as health insurance, paid leave, and employer-supported retirement benefits to full-time employment.
Both Australia and the United States have high rates of female labour force participation when compared to other industrialised countries. Across the OECD and in Australia, female labour force participation rates have increased steadily since the turn of the millennium.1 In the United States, however, female labour force participation has experienced a relative decline from 2007, which the Executive Office of the President attributes to the ageing US population, the global financial crisis and ensuing Great Recession of 2008, and other cyclical and demographic factors. The decline in female labour force participation in the United States is consistent with a decline in overall labour force participation from 65.9 per cent in 2007 to 62.8 per cent in 2014.2
Maternal employment
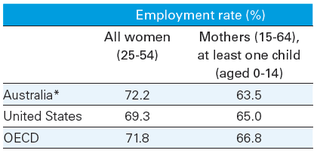
Whilst labour force participation measures the pool of women who are employed or actively seeking work, and is an indication of women’s interest in working, the employment rate measures the extent to which those women willing to work are in employment. Across the OECD, the employment rate for women with dependent children is lower than for all women aged 25-54, suggesting that the presence of children decreases the likelihood of a woman being found in employment.3
Australia has witnessed an increase in maternal employment compared to the United States, where maternal employment rates have fallen markedly over the past decade.4
Table 2: Maternal employment rates, 2013
Source: OECD (2013), OECD Family Database, LMF 1.2 Maternal Employment, viewed on 1 February 2016 at http://www.oecd.org/els/family/database.htm *Based on 2011 data
Comparing maternal employment rates in Australia and the United States over time, we can see that gap has narrowed significantly, although both countries remain demonstrably below the average for other industrialised OECD member states, as shown in Table 2.
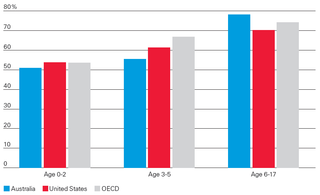
In Australia, the United States and across the OECD, women’s employment rates vary according to the age of the youngest. Although direct comparisons are difficult due to the different age-ranges used in the datasets, Figure 8 shows broadly how maternal employment rates in Australia and the United States compare depending on the age of the youngest child in the household.
Figure 8: Maternal employment (%), by age of youngest child, 2011
Source: OECD (2013), OECD Family Database, LMF 1.2 Maternal Employment, viewed on 1 February 2016 at http://www.oecd.org/els/family/database.htm *Australian data based on the following age groups: 0-4; 5-9; 10-14.
Hours of paid work: full-time vs. part-time employment
There are significant differences between the United States and Australia when it comes to the gendered distribution of full-time and part-time employment. In Australia, females are significantly more likely to be employed part-time than in the United States and when compared to the average for OECD member states.5 There is no universal definition of part-time work, which is measured differently across different countries. Australia and the United States define part-time work as usual working hours under 35 hours per week, but the OECD defines part-time work in terms of usual working hours under 30 hours per week.6 For comparative purposes the 30 hour measure is employed here.
Female workers in the United States are more likely to be in long-hours, full-time employment than either Australian women or women employed across OECD economies. In 2014, three-quarters (or 66.5 per cent) of women in the United States worked 40 hours or more per week, compared to 28.5 per cent of women in Australia and 50.5 per cent of women across the OECD.7 Of the 25.8 per cent of the female population employed part-time in the United States, 4.7 per cent reported that they were in part-time employment due to economic reasons, such as poor business conditions, slack work, or the inability to find full-time work, while 19.7 per cent were in part-time employment for reasons including personal obligations, childcare problems, school and training, retirement, and other non-economic reasons.8
Part-time work is a significant feature of women’s employment in Australia, but is especially marked between the ages of 25 and 54, women’s peak childbearing and childrearing years. In 2014, 32.8 per cent of women in this age bracket worked part-time in Australia, compared to 22.4 per cent across the OECD.9 In the United States, around 18.5 per cent of women aged 25-54 worked part-time in 2014.10
Women with dependent children are especially likely to be engaged in part-time work in Australia. Although the rate of full-time employment increases as the youngest child in the household grows older, part-time employment remains the predominant form of employment among working mothers with younger children.11
Among working mothers in the United States, by contrast, full-time employment is the norm. According to Bureau of Labor Statistics data, 49.4 per cent of the civilian non-institutional12 female population with a child under age 18 were employed full-time, working 35 hours per week or more, in 2014, compared to 16 per cent who were employed part-time, 4.3 per cent who were unemployed, and 30 per cent who were not in the labour force.13
Among the civilian non-institutional female population with a child under age 18 who were married and living with a spouse in 2014, 48.8 per cent worked full-time, 16.3 per cent worked part-time, 2.7 per cent were unemployed, and 32.2 per cent were not in the labour force.
Among mothers with a child or children under age 18 who were living in other marital arrangements (e.g. never married, separated, divorced, or widowed), 50.9 per cent worked full-time in 2014, compared to 16 per cent who worked part-time, 7.7 per cent unemployed, and 25.4 per cent who were out of the labour force.
Full-time employment among mothers increases with the age of the youngest child in the household, although full-time employment remains the norm for working mothers in the United States regardless of children’s ages.14 Whether they live in couple or single households, mothers are predominantly employed full-time or are not in the labour force. Compared to Australia, the share of part-time work in the United States is very low.
Actual vs. preferred working hours
Comparing the actual vs. preferred working hours of working women in Australia and the United States reveals some stark differences. In Australia over the period 2001 to 2011, 41 per cent of women working 35 hours per week or more indicated they would prefer to work fewer hours, compared to 4.3 per cent who indicated they would prefer to work more hours.15
The United States, in contrast, has a large number of full-time workers who report satisfaction with their working hours, or who want to work more hours. More than two-thirds, (or 69.6 per cent), of full-time female employees express satisfaction with their working hours, 20.3 per cent want to work more hours, compared to just 10.1 per cent who want to work fewer hours.16 Married women; women with advanced degrees; and women in higher paying jobs ($900/week or more) are significantly more likely to report overemployment, that is they would prefer to work less hours, than women in other categories.17
In Australia, the majority of working mothers with preschool-age (0-5) or primary school-age (6-12) children indicate a strong preference for part-time work. Among mothers working 15-29 hours per week, 71 per cent of couple mothers and 51 per cent of sole mothers expressed satisfaction with those hours, compared to 18 per cent of couple mothers and 40 per cent of sole mothers who have said they would prefer to work more hours.18 This is consistent with other nationally representative surveys which have found that part-time working women in couple households are generally satisfied with their working hours, while a larger proportion of lone mothers (who work an average of 27.8 hours per week) express a preference for longer hours.19
Among working mothers in the United States, the degree of overemployment varies by the age of the youngest child in the household. Women with preschool age children (0-5) are significantly more likely to report a preference for fewer working hours. Mothers with older teenage children (14-17), on the other hand, are more likely to report a preference for more working hours, or a greater proportion of income relative to time.20
Women in corporate leadership
Women’s representation in the ranks of senior management in large corporations in Australia has improved relative to the United States in recent years, but the situation in both countries remains far from gender equitable. Women hold fewer than one-quarter of board directorships, and less than five per cent of chief executive positions in the largest companies of both countries. Australia and the United States recently tied for 10th place among the 20 developed nations surveyed by Catalyst in terms of female board seats.21
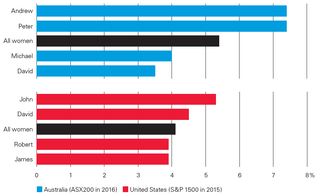
Reflecting on the lack of diversity at senior levels, two recent studies found that among chief executives of the S&P 1500, men named John, Robert, William and James outnumber women by a ratio of four to one.22 Among the 400 chief executive and chair positions at Australia’s 200 largest public companies, 26 were held by men named Peter, compared to 23 positions held by women in 2015 (who held their ground in absolute numbers against men named Michael).23
Australia
Over the past five years, Australia has taken a number of steps to increase gender diversity in senior corporate management, backed by regulatory moves and industry advocacy and cooperation. In 2011, for example, the Australian Stock Exchange (ASX) Corporate Governance Principles and Recommendations were updated to advise that listed companies should develop a diversity policy, and that a summary of that diversity policy should be publicly disclosed. In instances where companies elected not to develop a diversity policy, companies were instructed to indicate why they had not. Although it is not mandatory to follow the ASX guidelines, by 2013, 93 per cent of companies in the ASX200 disclosed their diversity policies and five per cent issued statements as to why they had not.24 More than three-quarters (82 per cent) indicated they had set measurable objectives to increase the representation of females and 84 per cent voluntarily disclosed the proportion of female board members.25
Figure 9: Male names of chief executives (%) vs. all women chief executives
Source: Conrad Liveris, What’s In A Name 2016, Workplace Insight, March 2016; Wolfers, J (2015), “Fewer women run big companies than men named John,” The New York Times, 2 March 2015, accessed on 15 January 2016, http://www.nytimes. com/2015/03/03/upshot/fewer-women-run-big-companies-than-men-named-john.html?_r=1
In 2010 and 2015, the Australian Institute of Company Directors and the federal government also introduced two jointly-funded diversity scholarships — the Board Diversity Scholarship Program and the Cultural Diversity Scholarship Program — for female executives and executives from culturally-diverse backgrounds to improve their skills and credentials. Nearly 200 women have attended this program since its inception, although it is not clear how many have progressed through the ranks as a result.26
The passage of the Workplace Gender Equality Act in 2012 further increased action and transparency around the gender composition of Australia’s workforce and the associated gender pay gap by requiring companies with 100 or more employees to provide detailed annual reports about gender balance to the Workplace Gender Equality Agency (WGEA), a mandate that has not been without controversy.27
Since the establishment of these various initiatives, the proportion of women on the boards of Australia’s largest public companies has doubled, from 10.7 per cent in 2010 to 21.7 per cent in 2015.28 The proportion of women comprising new ASX 200 board appointments rose nearly seven-fold, from five per cent in 2009 to 34 per cent.29
However, the proportion of female chief executive officers in Australia’s 200 largest public companies has not improved at the same rate.30 In 2012, women accounted for 3.5 per cent of CEOs in the ASX200, and just 2.4 per cent of CEOs in the ASX500.
Beyond the ASX200, women are better represented in senior levels of management, although these positions are still overwhelmingly dominated by men. Of the 12,229 employers that reported to WGEA in the 2014-15 financial year — which employed 40 per cent of Australia’s workers — women accounted for 36.5 per cent of all managers, including: 15.4 per cent of chief executives or heads of business; 27.4 per cent of key management personnel, 29.3 per cent of general managers/other executives; 33 per cent of senior managers; and 40 per cent of other managers. Part-time workers — the majority of whom are women — were largely excluded from management roles. Only 6.3 per cent of management-level positions were part-time.31
The gender pay gap is higher at upper levels of management than for non-managerial positions, with women in key management positions earning, on average, 29 per cent less total remuneration (including non-salary benefits, such as bonuses) than male managers in 2014-15, compared to a total remuneration pay gap of 20.9 per cent for non-managerial women.32
United States
In the United States, the proportion of women in senior ranks of management has remained relatively static over the past decade, with comparably few regulatory measures taken to increase transparency around women’s representation at the highest levels of business. From 2005 to 2013, female board representation on Fortune 500, which represents the country’s 500 largest public and private companies, grew by just two per cent.33
Female representation is slightly better in the most senior ranks of the S&P 500, the 500 largest publicly listed companies in the United States, where 19.2 per cent of board seats were held by women in 2015.
As in Australia, female representation among chief executives is worse than in board directorships. From 2006 to 2016, the companies of the S&P 500 have increased the overall number of female CEOs from 16 at the end of 2006 to 22 at the start of 2016. That’s one new female CEO every two years, or an overall gain of around one per cent.34
According to S&P Capital IQ, the Information Technology sector has the highest number of female CEOs — five — while the Energy, Materials, and Telecoms sectors do not have a single female CEO in the S&P 500 in 2016. On average, female CEOs also hold shorter tenures than male CEOs, with women holding an average of four years, compared to six years for men.35
Within the S&P 500, women accounted for 25.1 per cent of executive and senior-level officials and managers, and 36.8 per cent of first and mid-level officials and managers in 2013.36
Gender gaps in paid and unpaid labour
Women in Australia and the United States experience significant gender gaps when it comes to both money and time. This section examines the gender pay gap and the gender divide in unpaid household labour.
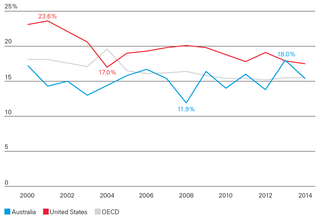
The gender pay gap in Australia and the United States is 15 per cent and 18 per cent, respectively. Over the past 20 years, the ratio of female-to-male earnings for full-time workers has hovered between 77 per cent and 85 per cent, despite continued public focus on this issue. Figure 10 shows the unadjusted gender pay gaps in Australia,37 the United States, and across the member countries of the OECD from 2000 to 2014.38
According to this index, which uses median full-time wages of males and females as the key indicator, Australia’s gender pay gap reached its most narrow point in 2008, when the median wages for women were just 11.9 per cent lower than for men, and reached its widest point, 18 per cent, in 2013. In the United States, the gender pay gap was widest in 2001, when the median wages for women were 23.6 per cent lower than for men, and reached its narrowest point, 17 per cent, in 2004.
National-level data
At the national level, Australia and the United States use slightly different measures to calculate the gender pay gap. In Australia, the reported gender pay gap is usually based on full-time adult weekly ordinary time earnings,39 whereas in the United States, the female-to-male earnings ratio is based on median yearly earnings among full-time, year-round workers.40 (These measures yield slightly different results to the annualised comparative data in Figure 10.)
Figure 10: Trends in the gender pay gap (total, % of male median wage), full-time employees, 2001-2014
Source: OECD (2016), Gender wage gap (indicator). doi: 10.1787/7cee77aa-en, accessed on 19 September 2016 at https://data.oecd.org/earnwage/gender-wage-gap.htm
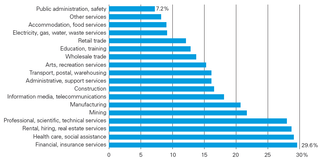
Figure 11: Australia: Gap between male and female earnings (%), by industry
Source: WGEA (2015), “National gender pay gap at record high of 18.8%”, Media Release issued 26 February 2015, accessed on 3 February 2016 at https://www.wgea.gov.au/sites/default/files/20150226_MR_GenderPayGapRecord.pdf.
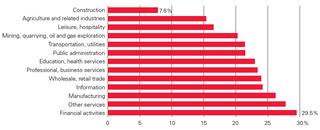
Figure 12: United States: gap between male and female earnings (%), by industry
Source: U.S. Bureau of Labor Statistics, Women’s earnings and employment by industry, 2009, accessed on 3 February 2016 at http://www.bls.gov/opub/ted/2011/ted_20110216_data.htm.
In Australia, the gender pay gap hit record highs in 2014 and 2015, at 18.2 per cent and 18.8 per cent, respectively. In the United States, women’s median earnings were 83 per cent of those of male full-time wage and salary workers in 2014, a gender pay gap of 17 per cent.
The gender pay gap is influenced by a range of complex economic and social factors, including: the disproportionate representation of men and women in different jobs (occupational segregation) and industries (industrial segregation); as well as other factors, such as women’s more precarious workforce attachment due largely to their unpaid caregiving responsibilities, the undervaluation of work typically done by women, stereotypes about what types of work men and women ‘should’ do, and direct and indirect discrimination.41
Nevertheless, gender gaps persist at the industry level. In both Australia and the United States, the highest pay gaps are found in the financial services industry, with gaps of 29.6 per cent and 29.5 per cent respectively. Figures 11 and 12 show the lowest gender pay gap in Australia was in public administration and safety industry, where the gap was 7.2 per cent in 2014, while the lowest pay gap in the United States is in construction, where the gap was 7.8 per cent in 2009.
Mandatory reporting
In Australia, the Workplace Gender Equality Act requires companies with 100 or more employees to provide detailed annual reports about gender and remuneration, as well as policies such as flexible work arrangements, to the Workplace Gender Equality Agency. As mentioned in the previous chapter this has not been without controversy.42
On 29 January 2016, following Australia’s lead, President Barack Obama announced new executive action requiring companies with 100 employees or more — which would cover 63 million employees — to report to the federal government how much their employees are paid against criteria including by race, gender, and ethnicity.43 The proposed regulation is being published by the Equal Employment Opportunity Commission (EEOC) and the U.S. Department of Labor, which will collect and analyse the data. The move does not require congressional approval, and will be reviewed by the Office of Management and Budget — part of the executive branch. The proposal has been opposed by the American Enterprise Institute and the U.S. Chamber of Commerce, which argue that it places “an unnecessary and onerous burden on employers while providing no meaningful insight”.44 The Australian experience suggests that even when legislation has mandated detailed pay, reporting it can remain a challenging and contentious issue for national policy makers and administrations. Nevertheless, the mission to increase female labour force participation is supported by politicians across the political spectrum.
Unpaid labour
The comparative data reveal substantial differences in the distribution of paid and unpaid labour among women in Australia, the United States, and across the OECD. On average, women in Australia spend 33 per cent less time in paid work and 25.4 per cent more time in unpaid work than women in the United States. Some of this disparity can largely be explained by the concentration of Australian women in part-time work, compared to their US counterparts (see labour force participation section).
Women in Australia spend 48.4 per cent less time in paid work, and 80.8 per cent more time on unpaid household work each day than men. This is significantly higher than the average for other industrialised countries in the OECD, where women spend 38.8 per cent less time in paid work and 49.3 per cent more time in unpaid work than men. This is reflective of women’s higher than average concentration in part-time employment, and the neo-traditional household model adopted by most couple families in Australia.45 The gender gap in paid and unpaid employment is significantly lower in the United States, where women spend, on average, 24.1 per cent less time in paid work and 35 per cent more time in unpaid work than men.46
On average, women in Australia spend 33 per cent less time in paid work and 25.4 per cent more time in unpaid work than women in the United States.
Where is this time spent? Women in Australia spend an average of 311 minutes per day (including weekends) performing unpaid domestic work, including 168 minutes of routine housework, 64 minutes caring for household members, 36 minutes of shopping, and 43 minutes on other unpaid household activities, such as volunteering, driving to and from household-related activities, and caring for non-household members.47 Men in Australia spend an average of 172 minutes per day on unpaid household chores, including 93 minutes on routine housework, 27 minutes looking after household members, 22 minutes on shopping, and 30 minutes on other unpaid household activities.48
Women in the United States spend an average of 248 minutes per day (including weekends) in unpaid housework, including 126 minutes on routine housework, 41 minutes caring for household members, 32 minutes shopping, and 49 minutes on other unpaid household activities, such as volunteering, driving to and from household-related activities, and caring for non-household members. Men in the United States spend 161 minutes per day on unpaid household chores, including 82 minutes on routine housework, 19 minutes looking after household members, 22 minutes shopping, and 38 minutes on other unpaid household activities.
Across the OECD, women spend an average of 274 minutes per day (including weekends) in unpaid housework. Men, in contrast, spend 139 minutes per day on unpaid household chores.49
National-level policy frameworks
Australia extends significantly more statutory protections to its employees than the United States. Many of these protections have been extended in the past decade, including the introduction of government-funded paid parental leave in 2010. In the United States, by contrast, the debate over whether and to what extent the federal government should set work-family policy is still hotly contested.
Here we outline the policy frameworks that support employees in Australia and the United States, and highlight key areas of difference.
Parental leave and other leave entitlements
In 2010, Australia legislated 18 weeks of parental leave pay for the primary caregiver of a child, payable at the national minimum wage (currently AU$657/week, before taxes).50 Employees must meet a minimum work requirement to be eligible, but the policy covers full-time, part-time, and casual workers, as well as the self-employed.51 In addition, employees are entitled to 12 months of job-protected unpaid leave, and the right to request a further 12 months of unpaid parental leave. Paid parental leave does not affect or reduce an employee’s right to take unpaid leave.
In 2012, 51.7 per cent of Australian organisations with 100 or more employees provided additional voluntary employer-paid parental leave (that is on top of the statutory paid parental leave standard). A further 5.1 per cent of large Australian firms said they planned to institute a voluntary paid parental leave scheme within the next 12 months. The average duration of this employer-funded leave was 9.7 weeks.52
The current Australian Government has a Bill before Parliament to reduce the number of weeks of government-funded parental leave pay by the number of weeks the employer pays. As this will financially disadvantage many families it is a contentious policy change and at this point in time it is unclear if the Bill will be passed.
The United States, in contrast, is the only industrialised country with no operational federally-mandated paid parental leave. After attending a meeting of G20 labour and employment ministers in Melbourne in 2014, US Secretary of Labor Tom Perez wrote that the United States was “distressingly behind the curve on paid family leave”, which he called a “21st century economic imperative”.53 Only 15 per cent of US firms with 100 employees or more offered any paid parental leave in 2012.54 Individual employers are free to set their own paid parental leave policies, which can range from a few days to several months.
The Family and Medical Leave Act 1993, remains the primary federal legislation providing job-protected unpaid leave for certain family and medical reasons, including pregnancy, childbirth, adoption, foster care placement, and care for a sick family member. This coverage extends only to employees of companies with 50 employees or more, and is only available to employees who have worked at least 1,250 hours in the past 12 months with the same employer.
Several states have supplemented these federal regulations to provide more extensive job-protected unpaid leave. Fourteen states, along with the District of Columbia, have lowered the firm-size threshold from 50 or more employees down to as low as ten employees.55 Seven other states have also adopted more generous leave lengths that allow longer unpaid absences for the purpose of child rearing. Only four states — California, New Jersey, New York, and Rhode Island — have paid family and medical leave laws.56
Paternity leave
In Australia, secondary caregivers who meet the minimum service requirements are entitled to two weeks paid leave at the national minimum wage, known as Dad and Partner Pay, within the first year after the birth or adoption of a child.57 In addition, more than a third (38.1 per cent) of Australian firms with 100 or more employees offered some form of paid paternity leave in 2012, of an average duration of 1.6 weeks.58
The United States provides no such leave for fathers or secondary caregivers. Recent high profile cases have seen men filing suits against private sector firms claiming that their maternity leave policies violate Title VII of the Civil Rights Act 1964, which prohibits employment discrimination on the basis of sex. Josh Levs of CNN, for example, filed a complaint before the Equal Employment Opportunity Commission (EEOC) that his company’s policy of giving biological mothers and male and female adoptive parents, or parents of surrogates ten weeks of leave, but granting biological fathers only two weeks of leave was discriminatory. His case is still pending.59
Annual and sick leave
Under Australia’s National Employment Standards, all full- and part-time employees (except casual workers60) are entitled to four weeks of annual leave per year, based on their hours of work. Shift workers may get up to five weeks per year.61 Australian workers are also entitled to paid sick and carer’s leave (10 days per year for full-time workers and pro rata of ten days per year for part-time workers) and two days of unpaid carer’s leave for each instance the employee’s family or household member needs support due to illness, injury, or other emergency.62 Most Australian workers, except casual workers, receive between ten and 13 public holidays, depending on the state or territory in which they live, if the holiday falls on a normally rostered work day.63
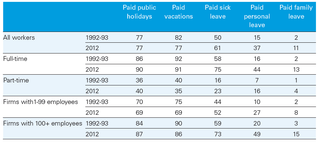
In the United States, there is no statutory minimum in relation to paid vacation or paid public holiday leave, and no statutory paid sick leave. With the exception of union-negotiated contracts, private employers are allowed to determine what leave to offer and on what basis. According to the U.S. Bureau of Labor Statistics, 77 per cent of private employers provided paid vacations and public holidays to their employees in 2012. The average number of paid vacation days offered by private sector employers was ten days after one year of service, 14 days after five years, 17 days after ten years, and 20 days after 20 years.
In short, the average full-time employee in the United States has to work 20 years to receive the basic statutory minimum granted to full- and part-time workers in Australia. Only around one-third of part-time workers are eligible for any form of paid annual or sick leave in the United States, as shown in Table 3.
Table 3: Access to paid leave in the United States (%), 1992-93 and 2012
Source: U.S. Bureau of Labor Statistics, National Compensation Survey, accessed on 11 February 2016, http://www.bls.gov/opub/btn/volume-2/paid-leave-in-private-industry-over-the-past-20-years.htm
Flexible work
Women and men are equally likely to use some flexible work options throughout their careers, but when such programs are absent, women downsize their aspirations more than men.64
In Australia, under the National Employment Standards, employees who have worked with the same employer for at least 12 months have the right to request flexible working arrangements if they are carers of children or adults, have a disability, are experiencing family violence, or supporting someone who is experiencing family violence. Employers have 21 days to respond to the request in writing, and may deny these requests only on “reasonable business grounds”, which include the cost or impracticality of implementing the request. There is no tribunal to appeal.65
In the United States, there is no law addressing flexible work schedules. Alternative work arrangements are a matter of agreement between the employer and the employee.66 The Fair Labor Standards Act 1938 (FLSA) has no provisions regarding the scheduling of employees. Therefore, an employer may change an employee’s working hours without prior notice or consent from the employee.67 The FLSA does stipulate that employees must receive overtime pay of at least one and one-half times their regular rate of pay for hours worked in excess of 40 hours in a work week. The FLSA does not require overtime pay for work conducted on weekends, holidays, or regular days of rest, unless overtime hours are worked on those days. Rates of pay on weekends and holidays are a matter of agreement between the employer and employee (or employees’ representative, in the case of unionised workplaces).68
Family benefits and childcare
The United States spends significantly less on family benefits as a percentage of gross domestic product (GDP) than Australia and the rest of the OECD.69 Much of this publicly funded family support is tied directly to employment, as it is delivered via tax breaks and credits (40 per cent of total support, as opposed to ten per cent in the OECD and 1.1 per cent in Australia).
With respect to childcare services, Australia spends less than most OECD countries, despite having above average public expenditure on families more broadly. On average, Australia and the United States spent 0.4 per cent of GDP on childcare services, compared with the OECD average of 0.6 per cent. This has contributed to relatively low childcare enrolment rates for young children, with only 40 per cent of children aged 0-6 enrolled in formal childcare in Australia, and 45 per cent in the United States, compared to 54 per cent across the OECD, as shown in Table 4.
The cost of childcare plays an important role in framing parents’ decisions to work. In Australia, for example, the cost of childcare has been shown to have a statistically significant negative effect on women’s participation in the labour force and on the overall supply of childcare places.70 In 2014, there were 153,300 children whose parent or parents reported a need for additional formal childcare for work-related purposes, according to the Australian Bureau of Statistics.71
Table 4: Public spending, and net cost of childcare, 2011-2012

Source: OECD (2014), Family Database, PF 3.1 Public spending on childcare and early education, accessed on 8 February 2016, http://www.oecd.org/els/family/database.html; OECD (2014), Family Database, PF 3.4 Childcare support, accessed on 8 February 2016, http://www.oecd.org/els/family/database.htm
In the United States, the net cost of full-time childcare for a two-year-old child in a typical childcare facility represents 28.7 per cent of the average wage for a dual-earner family, compared to 15.7 per cent in Australia and 12.6 per cent across the OECD.72 For a single-parent family, the net cost of this care represents 52.7 per cent of the average wage in the United States, compared to 13.8 per cent in Australia and 13.6 per cent across the OECD. Both Australia and the United States have childcare and pre-primary enrolment rates that are well below the OECD average for children aged 3-5.73
Who delivers the care?
In Australia, formal childcare is delivered via licensed long day care centres, occasional care facilities, or family day care centres, which are also accredited and monitored by state authorities. Among children aged 0-2, approximately 32.3 per cent were in informal care arrangements, primarily from relatives, compared to 35.8 per cent of two to three-year-olds, and 37.1 per cent of four-year-olds who were in informal care in 2014.74 In 2014, 30 per cent of children with two working parents, and 31 per cent of children with a single parent, received care from a grandparent.
In the United States, the picture is more complex. According to one U.S. Census Bureau population survey undertaken in 2011, 61.3 per cent of the 20.4 million children under the age of five were in some type of regular childcare arrangement. Preschool-aged children were more likely to be cared for by a relative (42 per cent) than by a non-relative (33 per cent), and 12 per cent were cared for by both relatives and non-relatives. Another 39 per cent of children had no regular childcare arrangement.
Among the 33 per cent who were cared for by non-relatives, almost one-quarter were cared for in organised facilities, such as a long day care centre (13 per cent) or a nursery/preschool (6 per cent). Overall, other non-relatives provided home-based care to 11 per cent of preschool-aged children, with five per cent cared for by family day care providers.
Due to the high cost of childcare in the United States, many families choose to use unlicensed childcare centres to provide formal care. Parents receiving subsidies from the Child Care Development Block Grants (CCDBG), the largest source of public funding for childcare, are not required to use licensed care. According to one estimate, nearly one in five children (19 per cent) who receive CCDBG assistance is in unlicensed care. In ten states, 30 per cent or more of children who receive CCDBG assistance are in unlicensed settings.75 Only four states prohibit unlicensed childcare providers from accepting federal subsidies.76 Most US states allow unlicensed childcare centres to operate legally. Twenty-seven states do not require a license for family childcare providers until they serve more than five children; eight states allow family childcare providers to care for six or more children without any license or oversight.77
Undocumented workers make up another (hidden) component of the childcare framework and network in the United States, although their prevalence in the care chain is difficult to measure due to the informal and transitory nature of their work. However, one recent survey of 2,086 domestic workers in 14 major cities found that 47 per cent were undocumented immigrants, who worked irregular hours for irregular pay.78
Educational attainment
Women largely achieve higher attainment of education than men in both Australia and the United States, although in both countries there remain significant gendered differences in relation to fields of study.
The United States and Australia have relatively high secondary school graduation rates for women, with Australian rates higher than those in the United States. In Australia, 89.5 per cent of women aged 20-24 attained a Year 12 qualification or higher in 2014, compared to 83.4 per cent of men in the same age range.79 In the United States, the proportion of females aged 18-24 who attained a high school degree (Year 12) or higher was 85.3 per cent, compared to 81 per cent of males.80
At the tertiary level, women in the United States and Australia have outcomes that exceed the average for industrialised nations within the OECD. Women in the United States have the highest educational outcomes in the comparison group, with 46.9 per cent of women aged 25-64 having completed some level of tertiary education in 2013, compared to 45 per cent of women in Australia and 37 per cent of women across the OECD.81
In the United States, Australia, and across the OECD, women dominate the same fields of study. Women represent the majority of graduates in education; humanities and arts; and health and welfare. Women are less well represented in computing; engineering, manufacturing and construction; and mathematics and statistics.82
National-level data — Australia
Using national-level data to examine gender outcomes in tertiary education, it becomes clear that women in Australia far exceed men in university attainment and, at the Bachelor Degree level, a greater proportion of Australian women (aged 25-29) have a degree than women in the United States (42 per cent compared to 37.2 per cent).
According to the Australian Bureau of Statistics (ABS), the gap between young women (aged 25-29) and young men who have attained a Bachelor’s Degree or higher has persisted over the past decade, from around ten per cent in 2004 to around 12 per cent in 2014, when 42 per cent of young women (aged 25-29) had attained a Bachelor’s Degree or higher, compared to 30.6 per cent of men.83
The attainment gap narrows at the postgraduate level, however, with 5.1 per cent of women (aged 15-64) in Australia attaining a postgraduate degree, compared to 4.9 per cent of men.84 Of all degrees completed in 2013, women attained 60.6 per cent of Bachelor’s Degrees, 64 per cent of Graduate Certificate or Graduate Diplomas, and 50.9 per cent of postgraduate degrees.85
National-level data — United States
The gender gaps in terms of tertiary education in the United States are of a similar scale. According to U.S. Census and Population data, the proportions of young women and men (aged 25-29) attaining a Bachelor’s degree or higher in 2014 were 37.2 per cent and 30.9 per cent, respectively.86 The gender attainment gap in the United States has hovered between five and seven per cent over the past decade.87
The gender gap narrows at the postgraduate level, however, with 10.3 per cent of all women (age 18 and older) achieving postgraduate degrees, compared to 10.4 per cent of men.88 In 2014, women accounted for 52.9 per cent of Bachelor’s degrees, 54 per cent of Masters or professional-level degrees, and 37 per cent of Doctoral degrees.89
Gender diversity: What can companies do?
Women in Australia and the United States share many similarities, but also some key cultural and economic differences. Australian women are more likely to work part-time after motherhood and live in neo-traditional household arrangements compared to their US counterparts. The differences could be attributable to cultural factors, such as family models, or institutional arrangements including, for example, the linkage of key benefits (such as health care, paid leave, and retirement packaging) to full-time employment in the United States.
Despite their concentration in part-time work and disproportionate share of household chores, women’s representation in the paid workforce has increased dramatically over the past decade, corresponding to the introduction of several key policy initiatives.
The information provided to this point has focused on national-level data and policies, providing the context for working women in the United States and Australia. In this section we turn our attention to what companies can do within the regulatory frameworks in which they operate, recognising that while women are citizens of a country they are employed by a company and their experience of day to day working life is often dictated.
Gender diversity is profitable. That is the conclusion from a global survey of 21,980 firms from 91 countries published in February 2016 by the Peterson Institute for International Economics, which found robust evidence that having more women in C-level positions is associated with higher firm profitability. This positive correlation could reflect the existence of discrimination against female executives elsewhere, giving non-discriminating firms an edge, or the fact that having women in senior management roles contribute skill diversity to the firm’s benefit.
Yet, despite this evidence, almost one-third of global companies have no women either at board level or in C-suite positions, 60 per cent have no female board members, 50 per cent have no female senior executives, and fewer than five per cent have a female chief executive.90
So how do companies achieve greater gender diversity in senior management? Here we set out some approaches organisations have used to build gender diversity in senior and strategic roles. We point to some leading industry practice in each area from business.
Set internal gender targets
Setting targets is good business practice. Companies that set specific and measurable diversity targets demonstrates commitment from senior leaders, gives gender equity a more quantitative substance, and makes companies accountable to both their female employees and investors alike.
In 2011, Ernst & Young (EY) Oceania set point-in-time gender targets for each level of business from manager to partner, and achieved 50:50 gender parity in all ranks up to and including senior managers by 2013.91
In 2010, 33 per cent of Westpac Group’s leadership team were women. The bank set a target of achieving 40 per cent representation by 2014 – which was achieved early in 2012. It is now aiming for 50 per cent women’s representation in leadership across the organisation in 2017.92
Conduct an internal gender pay audit
Three out of four employers in Australia don’t know if they are paying men and women fairly within their organisations.93 According to the Workplace Gender Equality Agency, only 26 per cent of employers conducted an internal gender pay audit in 2015. But a handful of leading Australian companies are taking these audits one step further — by making the results public.
The Big Four accounting firms, including EY, Deloitte, KPMG and Pricewaterhouse Coopers (PwC), are among a handful of Australian companies publishing the results of their gender pay audits publicly. In the media sector, Fairfax Media disclosed last year that it had narrowed its gender pay gap by four per cent following a 2014 audit of its merit pool that identified wide gender discrepancies in how merit-based salary increases were distributed. Across the group 121 men received merit payments, compared to 90 women.94
Expand and mainstream flexibility
Women working flexibly are Australia’s most productive workers, wasting three per cent less time and $14 billion less than their male colleagues every year.95 On average, women working flexibly deliver an extra week-and-a-half of productive work each year, simply by using their time more wisely. Companies can destigmatise part-time and flexible work by extending flexible working arrangements to all employees, regardless of gender or family responsibilities.
Several major Australian companies, including Telstra, the Australian Stock Exchange, the ANZ Bank, Westpac, and PwC have sought to extend flexible working hours to all employees, aiming to attract highly qualified staff by allowing them to determine their own hours and to make flexibility accessible to a broader group.96
In March 2016, the premier of New South Wales, Mike Baird, announced a commitment to offer flexible working hours to all senior staff in the state’s public service by 2019.97
Help employees access and pay for childcare
In Australia, the cost of childcare has been shown to have a statistically significant negative effect on women’s participation in the labour force.98 Firms that assist employees with caring responsibilities improve their chances of attracting and retaining the best talent.
On average, women working flexibly deliver an extra week-and-a-half of productive work each year, simply by using their time more wisely.
ExxonMobil Australia provides prioritised access to childcare services in close proximity to the company’s head office. The company credits the program with the 96 per cent return-to-work rate for employees retuning after a parental leave break.99
Build leadership capabilities and pathways
Management skills are fundamental stepping stone to leadership. Companies that invest in building management skills in women employees have a higher chance of moving those employees through the pipeline to more senior roles.
Men have benefited from both formal and informal mentioning and sponsorship in ways that have not been as accessible for women. Leading companies are building access for women to this experience.
In 2011, Aurizon, an ASX-listed rail freight company, created a diversity policy with measurable objectives and structured mentorship plans, including senior leadership development and a CEO office rotation program, to provide opportunities for work as associate executive officers with the company’s managing director and CEO. Between 2012 and 2013, the percentage of women in senior management jumped from 12 per cent to 26 per cent, and women in middle management rose from 29 per cent to 33 per cent.100
Raise investor awareness, and capitalise on pressure
Raising awareness among investors about the profitability of gender diversity in corporate leadership is a vital step, especially in the absence of a strong regulatory framework (e.g. the United States), but will not be a sufficient lever for change.
Capitalising on research on the profitability of companies with gender diverse leadership, in 2014, British bank Barclays began trading exchange-traded-notes (ETNs) that track a “Women in Leadership” index of US companies with gender-diverse leadership. The funds track a weighted index of 85 US-based firms that are listed on the New York Stock Exchange or NASDAQ and have a female chief executive officer or a board of directors that is at least 25 per cent female.102


